
Fig. 4.
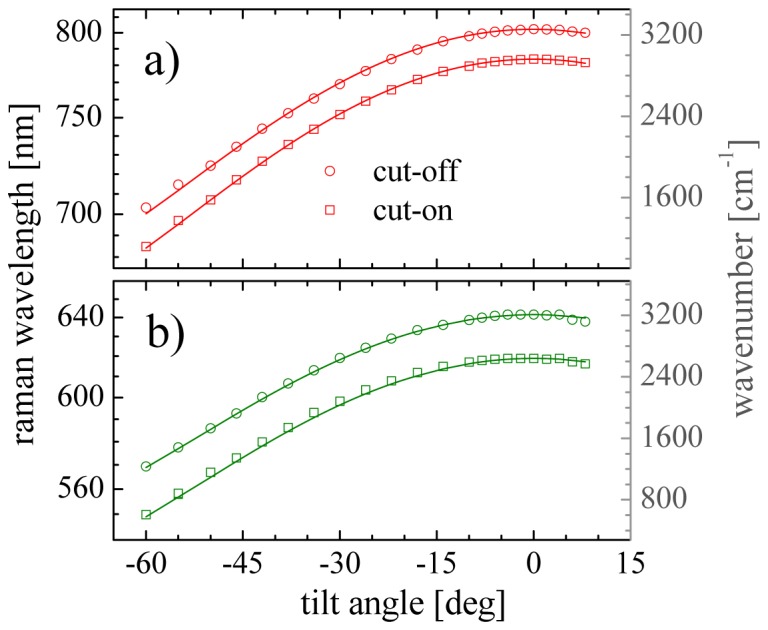
Filter tuning calibration for the two laser excitation sources used in the experiments at 636 nm (a) and 532 nm (b), respectively. Markers indicate the measured edge cut-on/off wavelength transition (as labeled) while solid lines are the fitted curves using Eq. (3).