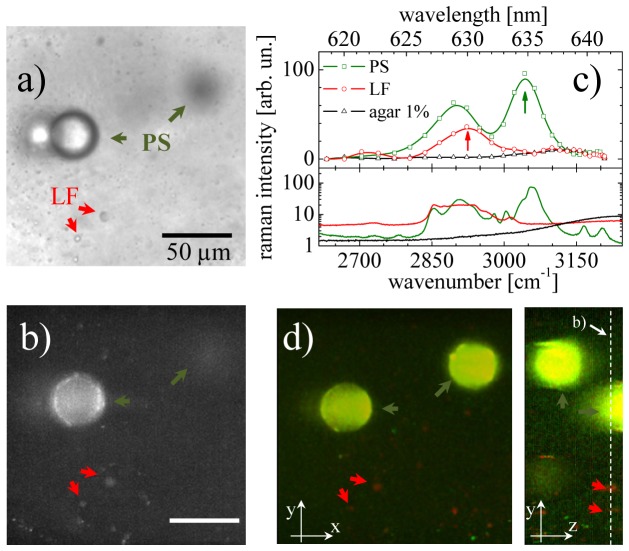
Fig. 6.
Optical sectioning and hyperspectral capabilities of Raman LiShM with tunable filters. a) Wide field image, b) single plane Raman image, c) Raman LiShM and Micro-Raman spectra, and d) hyperspectral image of samples composed of 50 µm polystyrene (PS) beads and lipofundine (LF) immersed in agar at 1%. Green and red arrows indicate PS beads and LF lipid droplets, respectively. The hyperspectral Raman LiShM image shown in (d) is the z-projection of a stack of merged images at the 2945 cm−1 and 3054 cm−1 Raman peaks (indicated with arrows in (c)). The transversal image reconstructed from the optically sectioned planes is shown in the inset image of (d). . Dashed line in (d) is the plane of image (b). Scale bar in b) is 50 µm

