
Fig. 7.
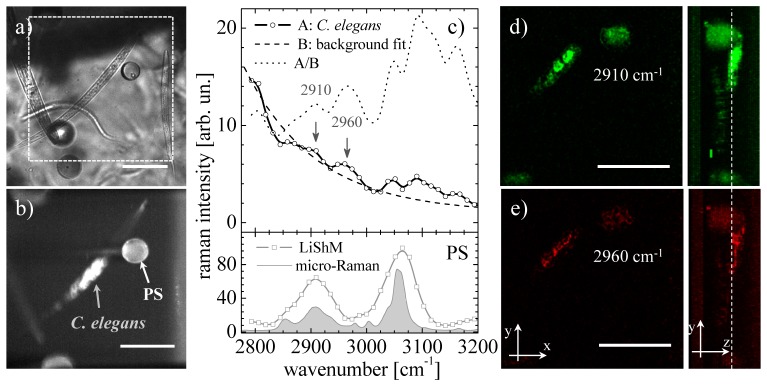
Raman LiShMS on C. elegans in agar at 1% with polystyrene beads as Raman markers. a) Wide field image, b) single plane Raman image, c) upper panel: Raman LiSh spectra coming from the intestine of the worm (solid black line), autofluorescente background (dashed line) and the ratio between these two spectra (dotted line); bottom panel: micro-Raman spectroscopy of PS taken with the LiSh system (gray line) and with a confocal Raman microspectrometer (Solid gray curve). d) spectrally resolved Raman images at 2910cm−1 and e) at 2960 cm−1, respectively. Scale bars are 100 µm. Dashed line in (e) is the plane of image in (b).