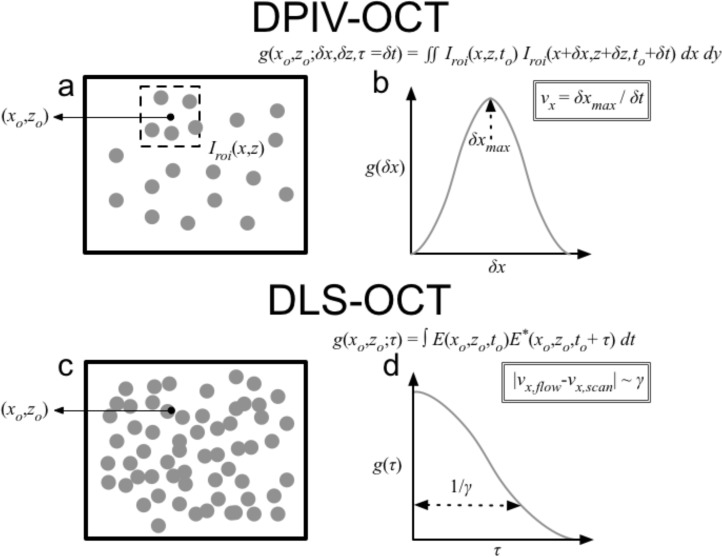
Fig. 1.
In this study, we use two distinct correlation-based approaches to directional OCT velocimetry: DPIV (a,b) and DLS (c,d). (a) In DPIV, two frames of intensity information I(x0, z0), acquired with an interframe time of δt, are compared against each. Each image is segmented into smaller regions of interest (ROI) Iroi(x, y), centered around the point (x0, y0), and cross-correlation is calculated in the spatial domain (δx, δz). The process is then repeated for multiple ROIs. (b) The corresponding correlation function g(x0, z0; δx, δz, τ) for each region exhibits a peak where δx = vxδt and δz = vzδt. Estimation of this peak location yields the velocity estimate for (vx, vz) (c) In DLS-OCT, the temporal signal at a single point (x0, z0) is correlated with itself, except now the complex field signal E(x0, z0, t), instead of the intensity, is used, and the correlation is calculated in the time domain. Additionally, scatterers are seeded significantly more densely such that speckle formation occurs. (d) The correlation function g(x0, y0; τ) exhibits a peak at τ = 0, but the rate of decorrelation (γ), i.e. the inverse of the width of the Gaussian, is proportional to the difference in velocity of the scanner and fluid flow. By modulating the scan speed , we can minimize the decorrelation rate γ and estimate as the minimum of that curve. The process is then repeated at multiple spatial locations (x0, z0).

