Fig. 5.
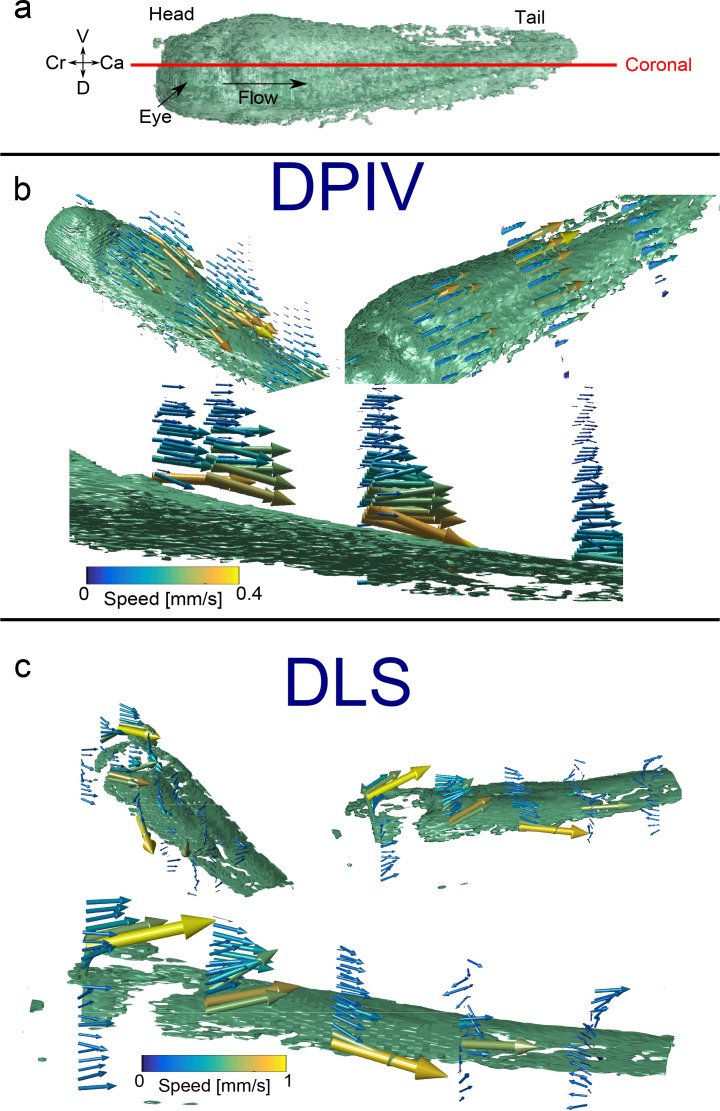
Measurement of 3D3C epithelial cilia-driven fluid in X. laevis. (a) Global oriention of embryo, showing rendering of surface (green) and flow directed primarily along the head-tail axis. Red line shows orientation of coronal planes. (b, Visualization 3 (1.3MB, MP4) ) Tadpole rendering with 3D quiver plot showing 3D3C velocimetry data, as reconstructed using DPIV from several perspectives. (c, Visualization 4 (1,009KB, MP4) ) Similar rendering, now with velocity field estimated using directional DLS-OCT. A portion of the embryo surface on the head is missing due to difficulties in automated segmentation. Note the difference in scale bar between the (b) and (c). Axes labels: L-left, R-right, Cr-cranial, Ca-caudal, D-dorsal, V-ventral

