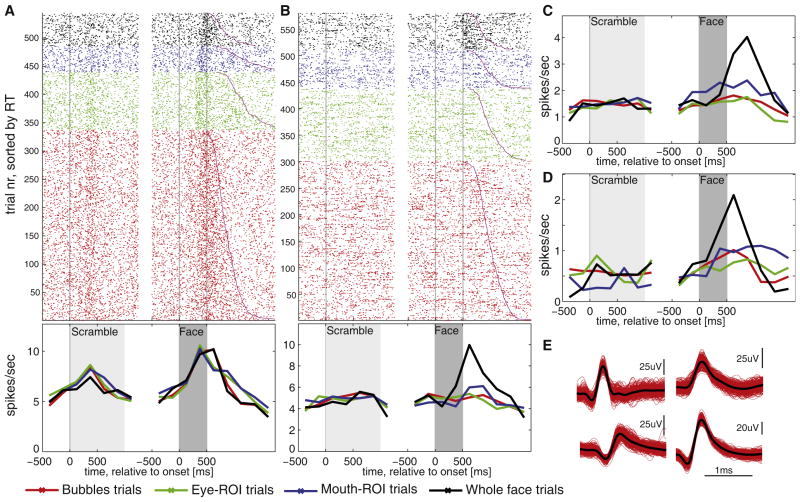
Figure 2. Single Unit Responses in the Amygdala.
(A–D) Examples of responses from four different neurons. Some responded to all trials containing facial features (A), whereas others increased their firing rates only to whole faces (B–D). Each of the units is from a different recording session, and for each the raster (top) and the poststimulus time histogram (bottom) are shown with color coding as indicated. Trials are aligned to scramble onset (light gray, on average 1 s, variable duration) and face stimulus onset (dark gray, fixed 500 ms duration). Trials within each stimulus category are sorted according to reaction time (magenta line).
(E) Waveforms for each unit shown in (A)–(D). Figure S2 shows the rasters for the units shown in (C) and (D).

