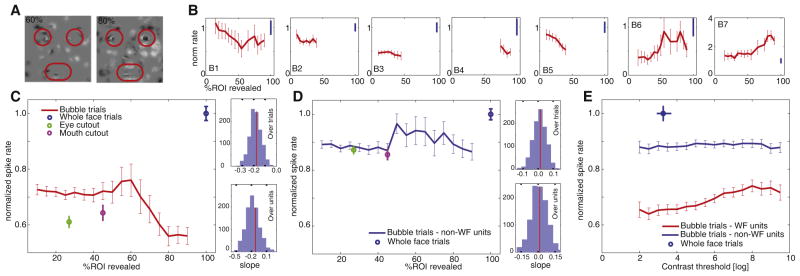
Figure 4. Response Profiles of Whole-Face-Selective Neurons.

The response to partially revealed faces did not predict the response to whole faces.
(A) Example stimuli for 60% and 80% of the ROIs revealed.
(B1–B7) Example neurons. Normalized response as a function of how much of the eye and mouth ROIs were revealed (B1–B6 increase rate for WFs, B7 decreases) is shown. Only data points to which at least ten trials contributed are shown (bin width is 15%, steps of 5%). Most neurons showed a nonlinear response profile when comparing bubbles and WFs: those that decreased their response with more bubbles increased it to WFs and conversely. The slope of the regression of percentage of ROI on spike rate was significant for units B1, B5, and B6. Different portions of the x axis are plotted for different neurons, because the patients were shown different densities of bubbles contingent on their different performance accuracies (unit B4 is from the patient who was shown a very high density of bubbles for comparison; cf. Figure S3 for further details).
(C) Population responses of all WF-selective neurons that increase their response to WFs (n = 32 units, 5,686 trials). The slope was −0.18 and significantly negative (linear regression, p < 1e-11) and the last and first data points are significantly different (two-sided t test, p < 1e-5). We verified the statistical significance of the slope across the units that contributed to this population response using a bootstrap statistic over trials and units (right side, average slope −0.18 ± 0.05 and −0.17 ± 0.13, respectively; red line indicates observed value). For the first half (5%–40%) the slope was −0.07 (p = 0.27, not significant [NS]), and for the second half (45%–90%) it was −0.44 (p < 1e-8).
(D) Population response for non-WF-selective units (n = 149, 15,922 trials). The slope was not significantly different from zero for the curve shown (p = 0.62) and across the population over trials and units (bootstrap statistic; right side, average slope 0.01 ±0.04 and 0.01 ±0.07, respectively). The last and first data points were not significantly different.
(E) Response for WF-selective (red) and non-WF-selective units (blue) is not a function of contrast threshold (the contrast threshold is a model-derived index of the visibility of the stimuli). The response of the control trials for eye and mouth cutouts used for selecting the units are shown in (C) and (D) for comparison. Errors are ±SEM over trials. See also Figure S3.
