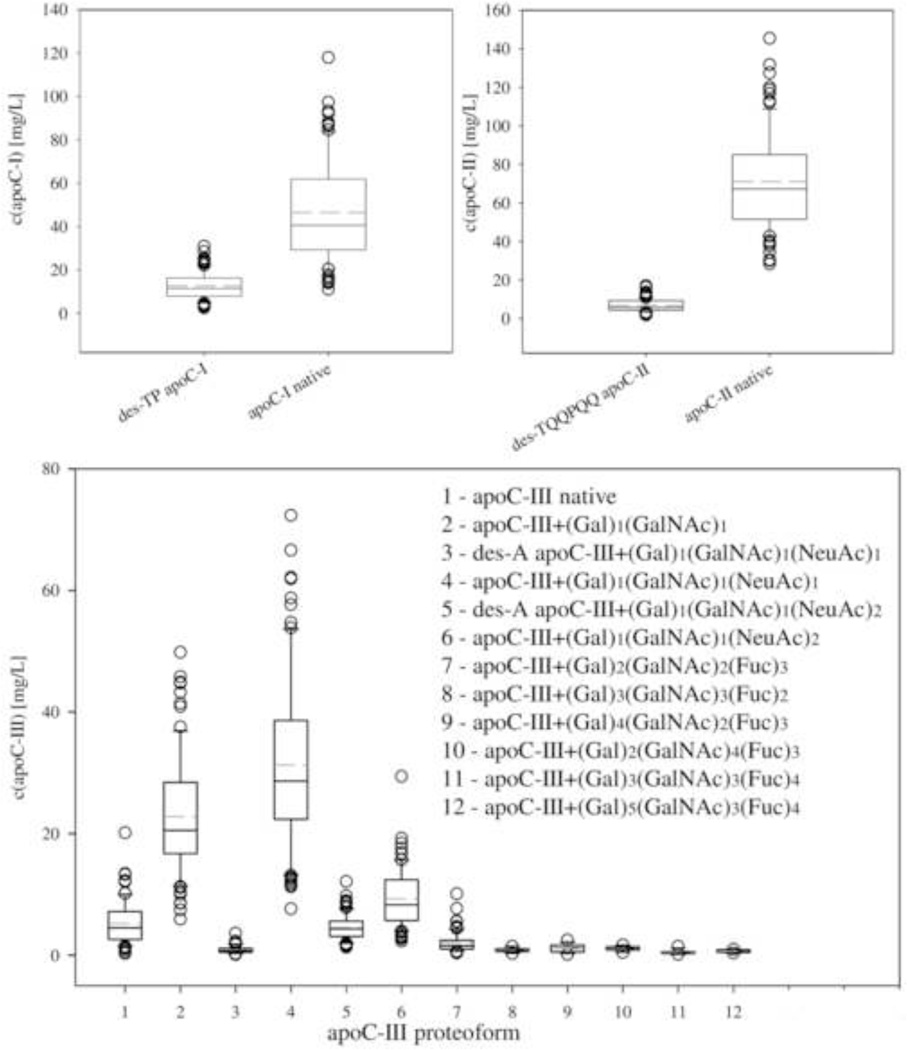
Figure 3.
Individual concentrations of apolipoprotein C-I, C-II and C-III and their proteoforms in a cohort of 82 human EDTA-plasma samples. Box - 25–75th percentile; Solid line – median concentration; Short dash line – mean concentration; Error bars – 10th and 90th percentile; Symbols – outlying points.

