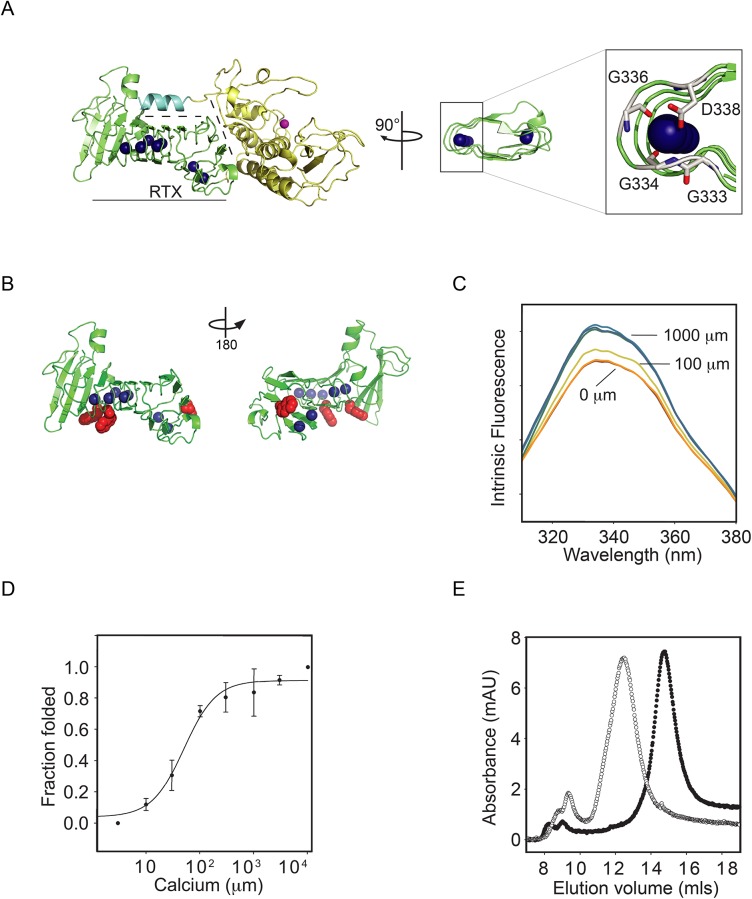
Fig 1. Calcium-induced PrtS-RTX folding.
The folding of the purified PrtS RTX domain was assessed biophysically as a function of calcium binding. A, a cartoon showing crystal structure of the PrtS protein is shown (based on the 1SAT PDB file).[10] The RTX domain is shown (green) separated by dashed lines from the protease domain (yellow) and the N-terminal helix (cyan). The blue spheres represent calcium ions that are bound within the structure and the active site zinc is shown in magenta. A close-in view of the bound calcium is shown on the right, coordinated within the RTX repeat sequence. B, a cartoon representation of the RTX domain is shown rotated about the vertical axis by 180°. The sidechains of the three native tryptophan residues are shown in red. C, representative tryptophan fluorescence emission spectra of PrtS-RTX in various calcium concentrations are shown. The normalized fluorescence intensity increases with increasing Ca2+ concentrations. Select calcium concentrations are labeled for clarity. D, the calcium-binding isotherm for PrtS-RTX is shown as a function of fluorescence intensity change and Ca2+ concentration. Data shown are mean ± standard deviation. E, representative analytical gel filtration chromatographs show the hydrodynamic states of apo (open circle) and Ca2+-bound (closed circle) PrtS-RTX protein.

