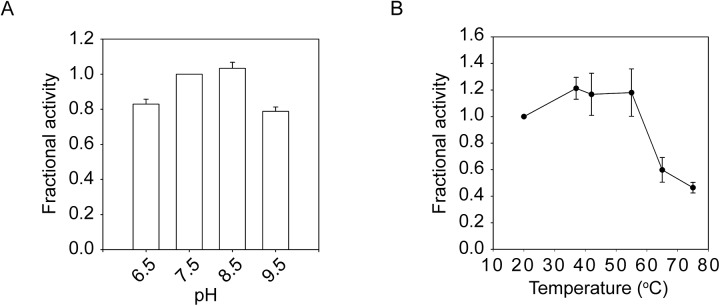
Fig 3. pH and temperature stability of PrtS.

The relative pH and thermal sensitivities of the refolded PrtS were assessed using functional assays. A, a bar graph showing the relative activity of PrtS between pH 6.5 and 9.5 is shown. Activity was normalized to that seen at pH 7.5. B, the relative activity of PrtS between 22–75°C is shown. Protease activity was normalized to that seen at 22°C. Data shown are mean ± standard deviation from at least three independent experiments.
