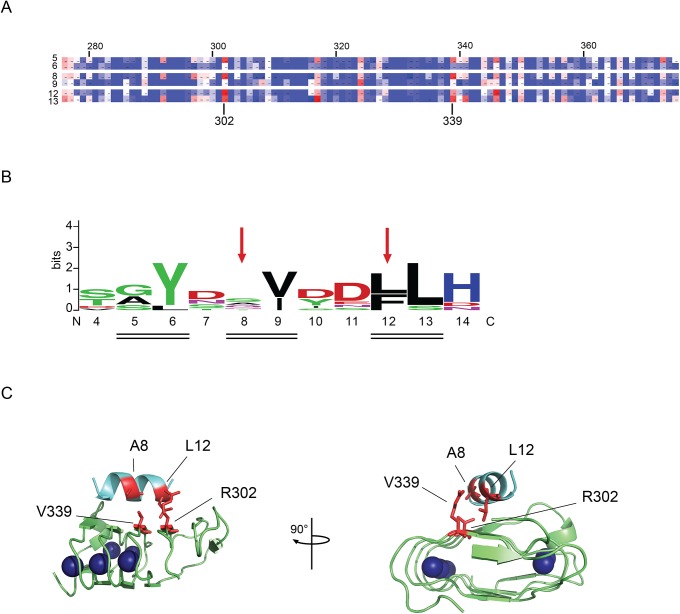
Fig 4. Domain-domain interactions in PrtS.
Paired cysteine residues were introduced into the RTX domain and the N-terminal helix based on covariance analysis of the serralysin family and the strucures of PrtS and Pseudmonas aeruginosa alkaline protease (PDB code 1SAT and 1KAP).[10,18] A, a heatmap of the covariance between the N-terminal helical residues and the folded RTX domain is shown. High covariance is colored red and low covariance is colored in blue. Residues in the N-terminal helix facing away from the RTX domain are omitted for clarity and show little covariance with the RTX domain. Residues are numbered according to the 1SAT PDB file on the left and top of the heatmap. The specific positions of R302 and V339 are indicated on the bottom of the heat map. B, a sequence logo of the N-terminal helix sequence from the serralysin family of protease is shown and numbered according to the PrtS structure. Red arrows show the positions of the cysteine substitutions in the N-terminal helix. The double lines indicated residues that are in direct contact with the folded RTX domain. C, a cartoon shows the N-terminal helix (cyan) packed against the RTX domain (green) in two views rotated about the vertical axis by 90°. Sites chosen for cysteine substitution are shown (red). The cysteine pairs are: A8-V339 and L12-R302. The bound calcium ions are shown as blue spheres.

