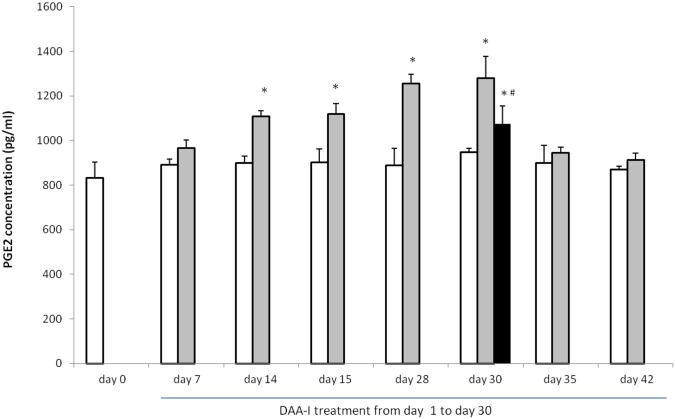
Fig 5. Temporal profile of circulating PGE2 in mice treated with 800 nmole/kg DAA-I.
Hollow histograms represent values obtained from mice that were administered vehicle, light solid filled histograms represent values obtained from mice that were administered DAA-I, and the dark solid filled histogram represents value obtained from mice that were administered DAA-I and losartan. Three animals were sacrificed at 1 hour post DAA-I or vehicle administration on the day indicated except on day 15 where the animals were sacrificed without DAA-I or vehicle administration. Each value is a mean ± S.E.M. obtained from 3 animals. Comparisons between groups were analyzed by One-Way ANOVA followed by Tukey’s post-hoc test. * p< 0.05 vs day 0; # p<0.05 vs DAA-I day 30.

