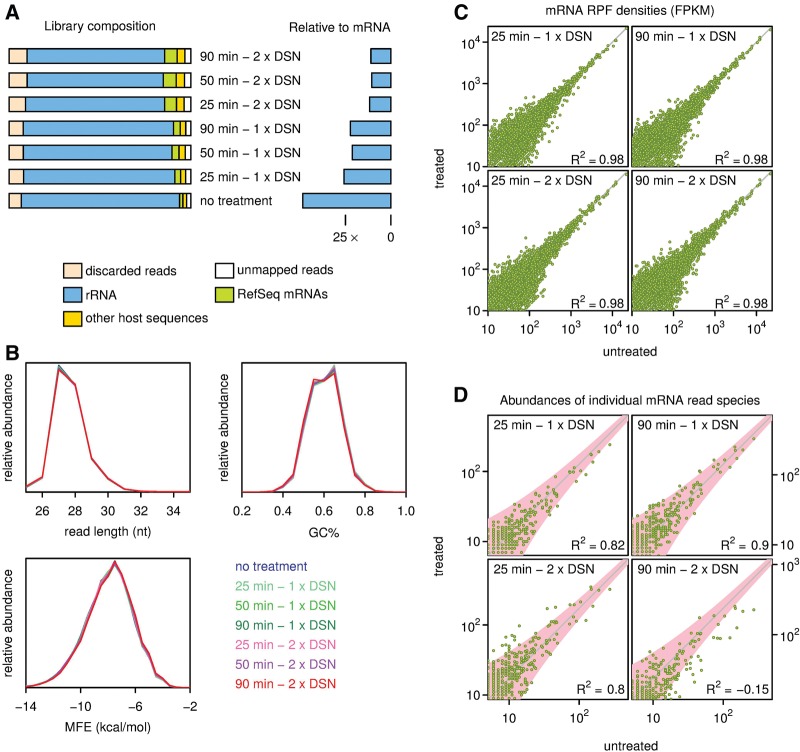
FIGURE 2.
Analysis of the DSN-based rRNA depletion strategy using Chlamydomonas samples. (A) Relative rRNA depletion for different DSN treatments. Library composition is shown on the left and the amount of rRNA contamination relative to mRNA is on the right (see also Table 1). (B) Read abundance in DSN-treated and untreated libraries expressed as a function of read length, GC composition, and minimum free folding energy (MFE) for reads mapping to mRNAs. (C) RPF densities based on all RPFs mapping to NCBI RefSeq mRNAs for DSN-treated and untreated samples, expressed as fragments per kilobase per million mapped reads (FPKM). (D) Abundances of distinct mRNA-derived read species in DSN-treated and untreated samples. The gray guideline indicates the expected relationship if there is no depletion of mRNA—the slope is the ratio of the total number of mapped mRNA-derived reads in each sample. A theoretical 95% envelope based on χ2 statistics is shown in pink. R2 is calculated for distinct RPF species that have >5 occurrences in the untreated sample and is relative to the expected relationship indicated by the gray line (not a linear regression line), hence the potential for negative R2 values.

