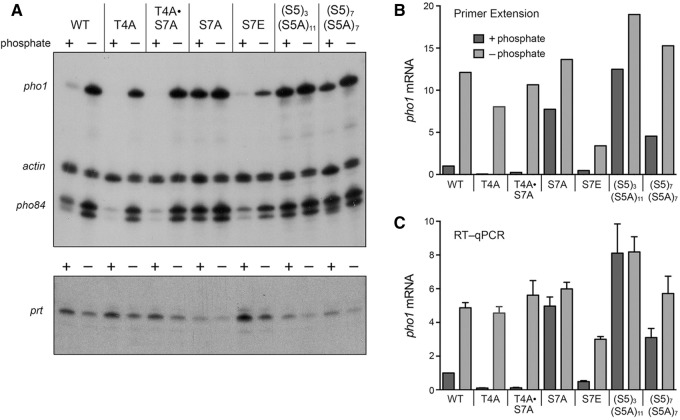
FIGURE 4.
Effects of CTD mutations on expression of phosphate-responsive mRNAs. (A) 32P-labeled primers complementary to pho1, pho84, and act1 mRNAs (top panel) or prt RNA (bottom panel) were annealed to total RNA isolated from the indicated fission yeast strains that had been incubated for 3 h in PMG medium containing 15.5 mM phosphate (+ phosphate) or lacking exogenous phosphate (− phosphate). After primer extension with reverse transcriptase, the reaction products were analyzed by denaturing PAGE and visualized by autoradiography. (B) The pho1 primer extension product in panel A was quantified and normalized to that of act1 measured for the same RNA sample. The bar graph shows the fold-change in pho1 relative to the wild-type + phosphate control (defined as 1.0). (C) RT-qPCR analysis was performed as described in Materials and Methods. The level of pho1 transcript was normalized to that of act1 measured for the same RNA sample. The bar graph shows the fold-change in pho1 RNA relative to the wild-type + phosphate control (defined as 1.0). Each datum in the bar graph is the average of values from RT-qPCR analyses of RNAs from three independent yeast cultures. The error bars denote SEM.

