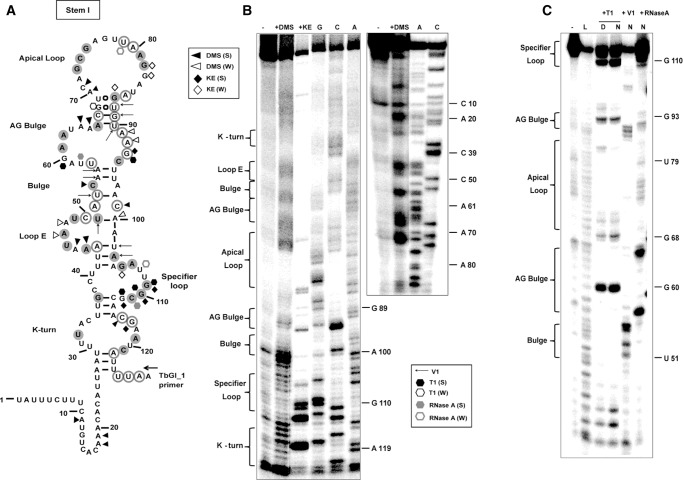
FIGURE 3.
(A) Chemical and enzymatic probing analysis of stem I region. TbGl_1 primer was used for Stem I primer extension analysis. Highly conserved (100%) and moderately conserved (66%) nucleotides are indicated with gray filled or open circles, respectively. (B) Chemical modification; (S) corresponds to strong and (W) to weak DMS or KE base modification. (C) Enzymatic probing analysis; (D) indicates denaturant conditions and (N) native conditions; (L) corresponds to the ladder constructed by alkaline hydrolysis reaction. (S) indicates strong and (W) weak susceptibility to cleavage by T1 RNase or RNase A. Arrows correspond to V1 RNase cleavage sites.

