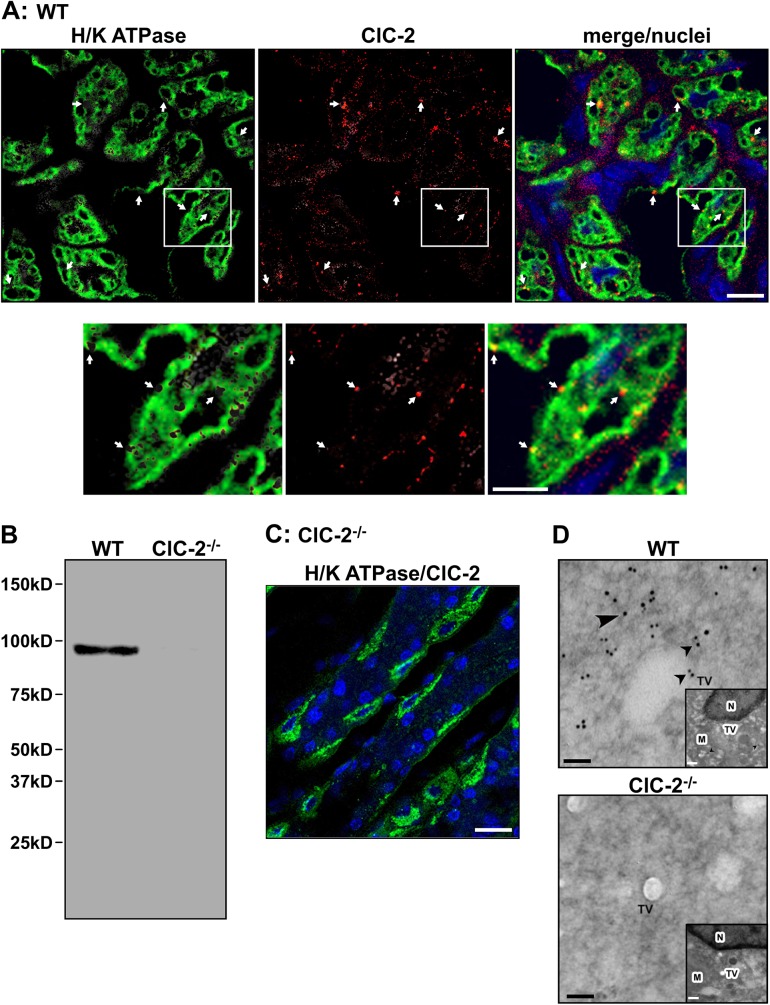
Fig 4. Immunolocalization and expression of ClC-2 in parietal cells of WT and ClC-2-/- mouse gastric mucosa.
(A) WT gastric mucosa was stained for both H/K ATPase (green) and ClC-2 (red). Nuclei are stained blue, bar = 25 μm. Lower panels show the area delineated by the white boxes magnified 2.5X, bar = 10 μm. (B) H/K ATPase (green) and ClC-2 (red) stained ClC-2-/- gastric mucosa. Nuclei are stained blue, bar = 25 μm. (C) Western blot of ClC-2 in WT and ClC-2-/- mouse gastric mucosa, with β-actin as loading control. Molecular weight markers are indicated. (D) Immunogold electron microscopy of ClC-2 in WT and ClC-2-/- mouse gastric parietal cells. Gold labelling is seen as large black dots (black arrowheads). TV, tubulovesicles, bar = 100nm. Inset shows lower magnification of the parietal cell showing M, mitochondria, TV and N, nucleus for orientation, bar = 1 μm. Representative figures of n = 10–20 regions examined.

