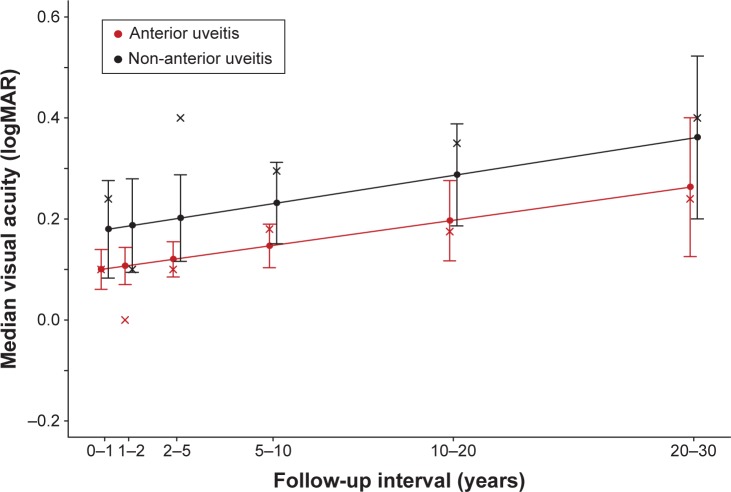
Figure 2.
Quantile regression predictions for patient level median logMAR as a linear function of follow-up time (years).
Note: Solid points identify the predicted median logMAR at the midpoint of the time interval and the “x” symbol identifies the empirical median logMAR for the time interval.
Abbreviation: logMAR, logarithm of the minimum angle of resolution.

