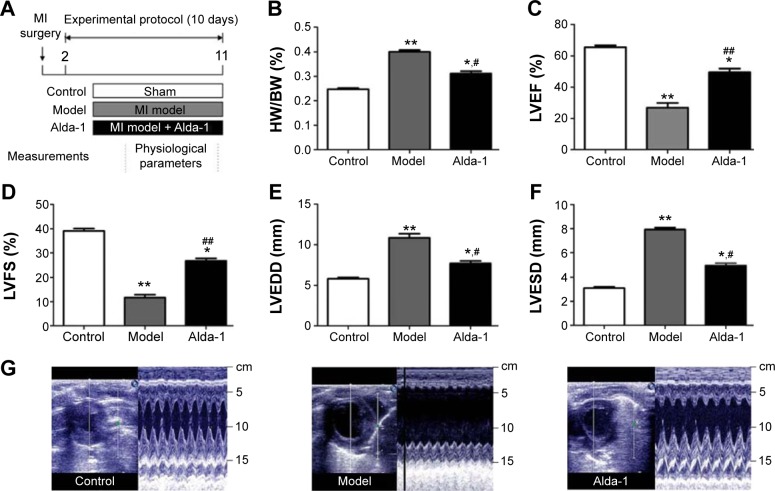
Figure 1.
Effects of MI on cardiac parameters.
Notes: (A) Schematic showing the model of post-myocardial infarction and treatment protocol, (B) HW/BW ratio, (C) LVEF, (D) LVFS, (E) LVEDD, (F) LVESD, and (G) two-dimensional-guided M-mode echocardiographic images of the left ventricle. Values are expressed as mean ± SD. Control group (sham, white bars, n=14, dead: 0), MI model group (Model, gray bars, n=11, dead: 3), and Alda-1-treated group (Alda-1, black bars, n=12, dead: 2) are shown. *P<0.05, **P<0.01 vs the control group; #P<0.05, ##P<0.01 vs the model group.
Abbreviations: HW/BW ratio, heart weight/body weight ratio; LVEF, left ventricular ejection fraction; LVFS, left ventricular fractional shortening; LVEDD, left ventricular dimension at end diastole; LVESD, left ventricular dimension at end systole; MI, myocardial infarction.

