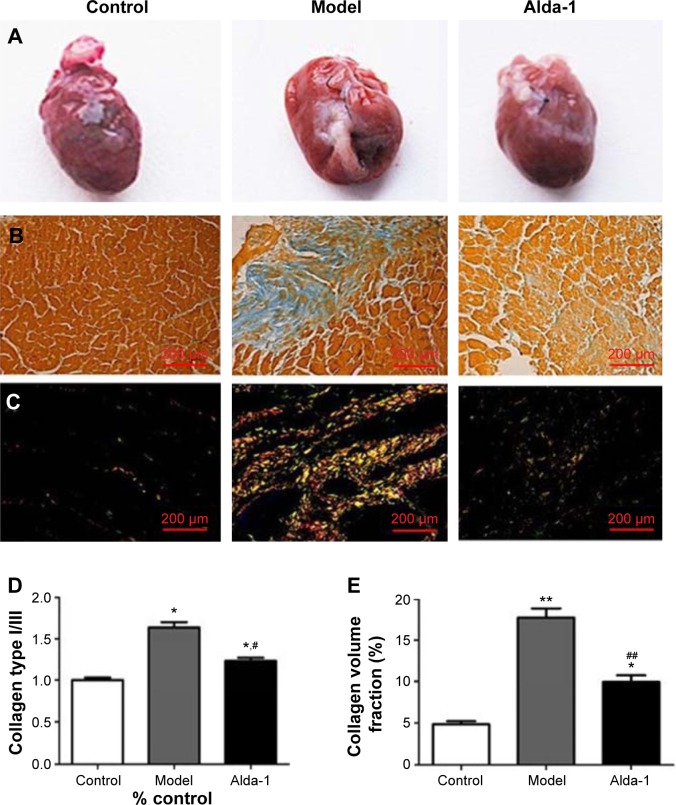
Figure 2.
Light microscopy photomicrographs of heart tissues.
Notes: (A) Representative gross images of whole hearts; (B) representative images of heart stained with Masson’s trichrome; (C) cardiac interstitial fibrotic areas stained with Sirius Red; (D) morphometric analysis of areas depicted in (B). Each bar represents the area occupied by interstitial fibrosis as calculated from Masson’s trichrome sections (average of six animals per group); (E) collagen type I/III depicted in (C) (average of six animals per group). *P<0.05, **P<0.01 vs the control group; #P<0.05, ##P<0.01 vs the model group. The dimensional bars were added in the images.

