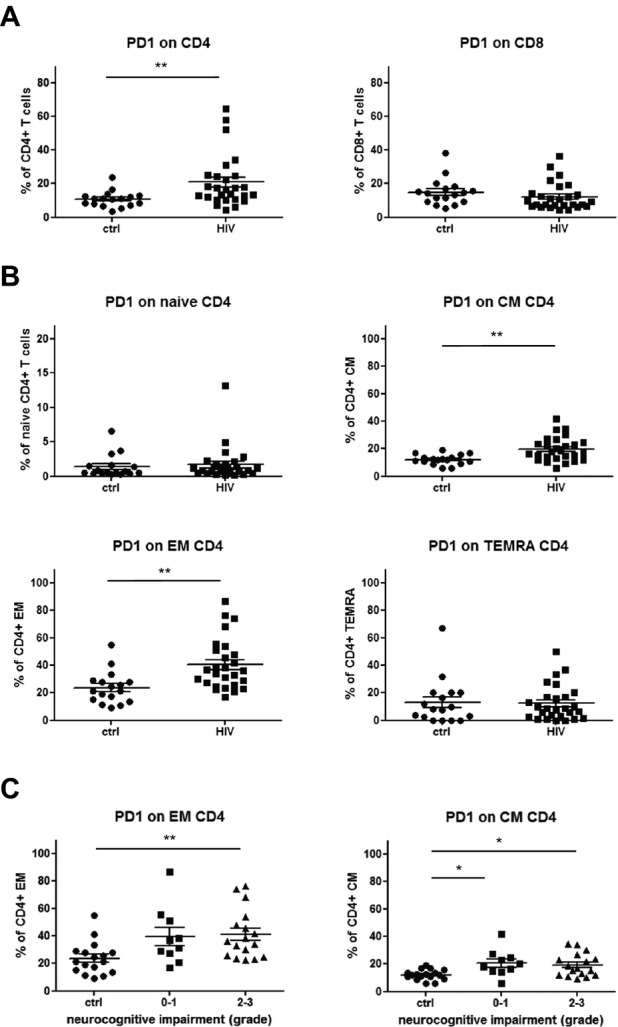
Figure 5.

PD-1+ expression on CD4+ and CD8+ T-cell subsets. (A) PD-1 expression was determined in T cells from control (ctrl, n = 17; closed circles) and HIV patients (HIV,n = 27; closed squares) by flow cytometry. (A) Graphs comparing the percentage of PD1+ cells within CD4+ and CD8+ T cells in control and HIV-patients. (B) Graphs showing percentages of PD1+ cells on different CD4+ T-cell subsets from control and HIV patients, respectively. (C) Scatter plots illustrating the analysis of PD-1+ cells in relation to the grade of neurocognitive impairment in HIV patients (grade 0–1 and grade 2–3). P values were calculated using Mann–Whitney test for comparison of two groups, and Kruskal–Wallis test with post hoc Dunn Multiple Comparison analysis for the comparison of three and more groups. Asterisks denote different P values: *P < 0.05; **P < 0.01. For detailed statistics see Table S4A–C.
