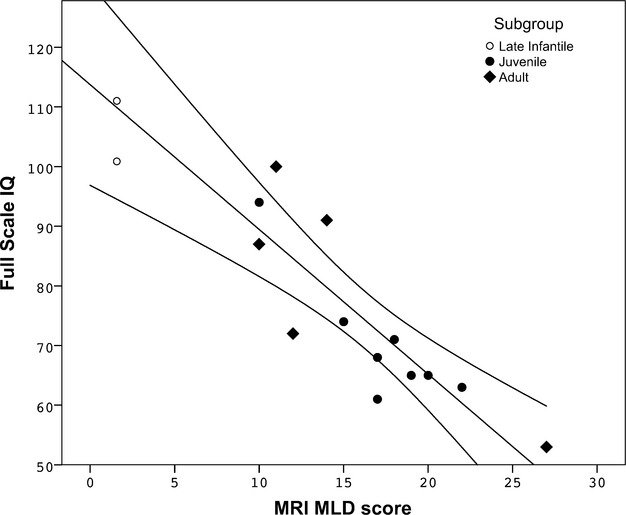
Figure 3.

MRI score plotted against FSIQ (n = 13), showing strong correlation between FSIQ and MRI severity scores (MRI-MLD score; r = −0.87, P < 0.001 (Spearman). Developmental index data were available on two younger patients, which data points were included in the figure, but not for analysis and trend-line calculation. FSIQ, full-scale intelligence quotient; MLD, metachromatic leukodystrophy.
