

Abstract
Aims
This open label study was conducted to assess the effect of renal impairment (RI) on the pharmacokinetics (PK) of peginterferon lambda-1a (Lambda).
Methods
Subjects (age 18–75 years, BMI 18–35 kg m–2) were enrolled into one of five renal function groups: normal (n = 12), mild RI (n = 8), moderate RI (n = 8), severe RI (n = 7), end-stage renal disease (ESRD, n = 8) based on estimated glomerular filtration rate (eGFR) calculated using the Modification of Diet in Renal Disease (MDRD) equation. Subjects received a single dose of Lambda (180 µg) subcutaneously on day 1 followed by PK serum sample collections through day 29. Safety, tolerability and immunogenicity data were collected through day 43. PK parameters were estimated and summarized by group. Geometric mean ratios (GMR) and 90% confidence intervals (CIs) were calculated between normal and RI groups.
Results
With decreasing eGFR, Lambda exposure (Cmax, AUC) increased while apparent clearance (CL/F) and apparent volume of distribution (V/F) decreased. Relative to subjects with normal renal function (geometric mean AUC = 99.5 ng ml–1 h), Lambda exposure estimates (AUC) were slightly increased in the mild RI group (geometric mean [90% CI]: 1.20 [0.82, 1.77]) and greater in the moderate (1.95 [1.35, 2.83]), severe RI (1.95 [1.30, 2.93]) and ESRD (1.88 [1.30, 2.73]) groups. Lambda was generally well tolerated.
Conclusions
The results demonstrated that RI reduces the clearance of Lambda and suggests that dose modifications may not be required in patients with mild RI but may be required in patients with moderate to severe RI or ESRD.
Keywords: pharmacokinetics, peginterferon lambda-1a, renal impairment
WHAT IS ALREADY KNOWN ABOUT THIS SUBJECT
Peginterferon lambda-1a is a novel type III interferon having potent antiviral effects in subjects with hepatitis C virus (HCV).
The kidneys are a major site of proteolysis and facilitate the elimination of therapeutic proteins.
Following administration of pegylated interferons to subjects with impaired renal function clearances of these proteins have been shown to be decreased
WHAT THIS STUDY ADDS
Renal insufficiency reduces the clearance of peginterferon lambda-1a, similarly to other pegylated interferon products used in the treatment of HCV.
Introduction
Interleukin 29 (IL-29), also known as interferon (IFN) lambda-1a (IFNλ) is a member of the type III IFN family whose biological characteristics are similar to those of type I IFNs, such as IFNα and IFNβ [1,2]. Type I and type III IFNs exhibit in vitro activity against a similar array of viruses (e.g. vesicular stomatitis virus, hepatitis C virus [HCV] and hepatitis B virus [HBV]) and regulation of host antiviral responses via similar intracellular signalling pathways [3,4]. The receptor for IL-29 comprises the IL-28 receptor alfa (IL-28Rα) and IL-10 receptor beta (IL-10Rβ) and expression is limited in comparison with that of the type I IFN receptors, in particular on haematopoietic cells [5]. This comparatively limited expression suggests that IL-29 administration may be associated with fewer systemic adverse effects, especially haematological side effects, than following administration of type I IFNs. IFNλ in both the native and pegylated forms has been shown to be active in preclinical systems [6]. Thus, to prolong interferon lambda-1a exposure, thereby increasing dosing interval, IFNλ was covalently conjugated to a 20 kDa linear polyethylene glycol (PEG) chain to form peginterferon lambda-1a (Lambda), having a total molecular weight of approximately 40 kDa. Lambda was being studied in the treatment of HCV as weekly subcutaneous (s.c.) 180 µg doses with ribavirin and direct acting antiviral agents at durations of 12 to 48 weeks of treatment [7].
Protein therapeutics, like endogenous proteins, undergo proteolysis as the primary route of elimination. While proteolysis can occur throughout the body, the kidneys serve as a major site of proteolysis and a primary mechanism of elimination for therapeutic proteins/peptides ≤ 60 kDa in size. The mechanisms for elimination by the kidneys include glomerular filtration followed by either reabsorption into endocytic vesicles and subsequent hydrolysis, or by intraluminal metabolism via exopeptidases, both in the proximal tubules, and peritubular extraction of proteins from postglomerular capillaries with subsequent intracellular metabolism [8]. For IFNs, the mechanism of elimination has been characterized as renal filtration, with subsequent re-uptake and catabolism by renal tubules [9–11]. The elimination of PEG conjugated to proteins is unknown, but the primary route of elimination of PEG for all sizes is via urinary excretion [12]. For unconjugated PEG with molecular weights up to and including 190 kDa, elimination is primarily mediated via urinary excretion. It is assumed that because of the size of the PEG molecules conjugated to proteins, once the covalent linkage to the protein is broken, urinary excretion would also be the major route of elimination [13].
In the current draft guidance document for the assessment of pharmacokinetics in subjects with impaired renal function, the recommendation is that for drugs with a molecular weight less than 69 kDa, a renal impairment study is recommended [14]. Following administration of peginterferon alfa-2a (60 kDa) clearance decreased with decreasing renal function and, in subjects with ESRD, a 25% to 45% reduction in total body clearance (CL/F) was observed [15]. Following single dose peginterferon alfa-2b (32 kDa) administration, Cmax and AUC were increased up to approximately two-fold and clearance was decreased up to 45% in subjects with ESRD [16]. Lambda, which has a similar molecular size to these peginterferons, would be expected to be influenced by reduced capacity for protein degradation in subjects with renal impairment. Preclinically, in partially nephrectomized rats, the clearance of Lambda was decreased compared with controls (internal data).
The purpose of this study was to determine the effect of renal impairment on Lambda exposure by assessing the pharmacokinetics following administration of a single 180 µg s.c. dose of Lambda in subjects with normal renal function and subjects with mild, moderate, severe and end-stage renal dysfunction
Methods
The study design was an open label, single dose study of subjects with normal renal function and subjects with mild, moderate, severe and end-stage renal dysfunction. The study was approved on 30 August 2012 by Independent IRB, Sunrise, FL, USA (Registration Number IORG0000635), by Aspire IRB, Santee, CA, USA (Registration Number IORG0003876) on 4 September 2012 and by Crescent City IRB, New Orleans, LA, USA (Registration Number IORG0005426) on 10 September 2012.
After signing informed consent, subjects underwent screening evaluations within 21 days of drug administration. Subjects were eligible to participate in the study if they were aged 18–75 years, inclusive, and not infected with HIV, HCV or HBV. All subjects were to have stable renal function, defined as no change in renal function group between screening and day –1, and have a minimum body weight of 50 kg. Women of childbearing potential (WOCBP) used highly effective methods of birth control (for up to 4 weeks prior to the start of Lambda, during the entire duration of the study, and for a minimum of 12 weeks after the last dose of Lambda) to minimize the risk of pregnancy.
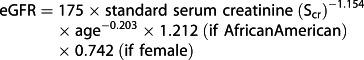
Subjects were assigned to one of five renal function groups based on their estimated glomerular filtration rate (eGFR) as calculated by the Modification of Diet in Renal Disease (MDRD) equation [17] (Table 1):
Table 1.
Subject baseline characteristics for normal subjects and subjects with varying degrees of renal impairment (RI)
| Renal function | |||||
|---|---|---|---|---|---|
| Normal | Mild | Moderate | Severe RI | ESRD* | |
| RI | RI | ||||
| Parameter | (n = 12) | (n = 8) | (n = 8) | (n = 7) | (n = 8) |
| Age, mean years (SD) | 52.8 (7.7) | 67.0 (4.5) | 66.4 (8.0) | 61.1 (8.9) | 51.6 (9.1) |
| Male, n (%) | 10 (83) | 2 (25) | 6 (75) | 3 (42) | 6 (75) |
| Race, n (%) | |||||
| White | 9 (75) | 4 (50) | 8 (100) | 4 (57) | 2 (25) |
| African American | 3 (25) | 4 (50) | – | 3 (43) | 6 (75) |
| BMI, mean kg m–2 (SD) | 28.1 (3.2) | 29.1 (3.7) | 29.6 (2.3) | 29.5 (3.3) | 29.3 (4.9) |
| eGFR, mean (SD)† | 96.9 (11.1) | 67.4 (6.4) | 43.0 (6.5) | 23.1 (2.7) | - |
| CLcr, mean (SD)‡ | 118 (24.1) | 69.1 (17.2) | 54.4 (7.4) | 30.7 (8.9) | - |
| Baseline proteinuria, n (%) | |||||
| Negative/Trace | 12 (100) | 8 (100) | 6 (75) | 5 (71.4) | - |
| 2+/3+ | - | - | 2 (25) | 2 (28.6) | 4 (100)§ |
All patients with ESRD were receiving HD.
eGFR (ml min–1 1.73 m–2) calculated with MDRD equation.
Calculated by Cockroft–Gault (ml min–1).
Four subjects were evaluable.
 |
Groups were assigned based on the following eGFR: stage 1 CKD/normal: ≥ 80 ml min–1 1.73 m–2 (group 1), stage 2 CKD/mild renal impairment (RI): 60 to 79 ml min–1 1.73 m–2 (group 2), stage 3 CKD/moderate RI: 30 to 59 ml min–1 1.73 m–2 (group 3), stage 4 CKD/severe RI: 15 to 29 ml min–1 1.73 m–2 (group 4) and stage 5 CKD/end-stage renal disease (ESRD) < 15 ml min–1 1.73 m–2, on haemodialysis (HD) or non-HD (group 5).
Subjects were eligible to be in group 1 if they were generally healthy as determined by no clinically significant deviation from normal in serology, medical history, physical examinations (PEs), 12-lead electrocardiograms (ECGs), vital signs measurements, and clinical laboratory determinations, and had a body mass index (BMI; weight (kg)/[height (m)]2) of 18.0 to 32.0 kg m–2. For groups 2 to 5, subjects were deemed eligible if free from unstable clinically significant disease unrelated to renal disorder, as determined by serology, medical history, PEs, ECGs, vital signs measurements, and clinical laboratory determinations and have BMI of 18.0 to 35.0 kg m–2, inclusive. Previously, it was demonstrated that age, gender and weight did not meaningfully affect the PK of Lambda [7]. Thus, subjects in the normal renal function group were not matched based on demographics to those subjects in the RI groups.
Eligible subjects were admitted to the clinical site on day –1. On day 1, Lambda was administered as a single 180 µg s.c. dose (administered within 1 h following completion of HD for HD subjects in group 5). Subjects remained confined to the clinical site through day 15, and returned to the site for ambulatory visits on days 18, 22, 29 and 43. On day 43, subjects were discharged from the study after collection of the final immunogenicity sample and at the completion of all safety assessments. Subjects were monitored for safety via PEs, ECGs, physical measurements, vital signs measurements, clinical laboratory testing and adverse event (AE) observations. Blood samples for determination of serum concentrations of Lambda were collected at pre-dose (0 h) on day 1 and up to 28 days following single dose administration (day 29). Blood samples for the assessments of immunogenicity were collected on day 1 (pre-dose) and days 8, 15, 29 and 43.
Bioanalytical methods
Serum Lambda concentrations were determined using a validated Meso Scale Discovery (MSD) platform electrochemiluminescence (ECL) assay in which carbon electrodes integrated into the bottom of an assay plate excited a ruthenium label, emitting light, which was then read by the MSD Sector Imager [18]. A murine anti-Lambda monoclonal antibody coated on the surface of a standard MULTI-ARRAY® microplate captured any Lambda present in reference standards, serum controls and test samples. A second ruthenium-labelled murine anti-Lambda monoclonal antibody was then bound to the captured drug. Upon addition of the MSD read buffer to the plate, the resulting light emission was proportional to the amount of Lambda present in the sample, allowing for quantitation against the standard curve on the same plate. The assay had a quantitative assay range of 75 to 19 000 pg ml–1. Low, mid and high quality controls (QCs) were run at 200, 1500 and 14 500 pg ml–1. Pre-study validation accuracy and precision including five levels of QCs spanning the assay range including upper and lower limits of quantitation demonstrated inter-assay bias (%) ranging from –8.1% to –3.1 %, inter-assay precision, as demonstrated by the coefficient of variation (%CV), ranging from 2.3 to 4.1 %, and total error (|%bias| + %CV) ranging from 8.2 to 12.4%. In-study accuracy and precisions including high, mid and low QCs yielded inter-assay bias (%) ranging from –3.8 to 6.4 %, inter-assay precision (CV%) ranging from 4.5 to 5.4 %, and total error (%) of 8.3 to 11.8%. Assay specificity is described in detail in Myler et al. [18]. The Lambda detection assay is cross-reactive with the endogenous lambda counterpart. However, endogenous levels are normally below the limit of quantitation. The assay does not cross-react with other interferon family members and there is no interference from co-administered compounds, haemolytic or lipaemic products. Anti-drug antibodies (ADAs) do interfere in the assay once a certain threshold is achieved, making the correlation of PK/ADA data important for data interpretation.
ADAs to Lambda were also determined using MSD technology. Samples were pre-incubated with a mix containing biotinylated Lambda and ruthenylated Lambda allowing ADA present in the sample to bind both labelled forms of drug in a complex, which was captured on streptavidin coated MSD microplates. Read buffer was added to the plate and resulting light emission (RLU) was proportional to amount of ADA present in the sample. Controls were prepared using pooled ADA negative human serum [18] with or without polyclonal antibody immunoaffinity purified from hyperimmunized monkey serum. Low, mid and high positive controls were prepared at 62.5, 250 and 1000 ng ml–1. Relative assay sensitivity was determined using this surrogate polyclonal antibody to be approximately 62.5 ng ml–1 when tested in both the screen and confirmatory assays. The screening cut point factor (multiplicative) was 1.06 and the confirmatory cut point was 55%. Study samples that were greater than the floating cut point were further tested in the confirmation tier. Samples confirmed positive were titred using five-fold serial dilutions and were assessed in the cell-based neutralizing antibody assay. Specificity is an inherent characteristic of the tiered ADA assay design pertaining to the confirmatory tier discussed above. However, additional information pertaining to the rate of pre-existing antibodies and cross-reactivity with interferon superfamily members are detailed in Myler et al. [18].
Pharmacokinetic parameter estimates
The following non-compartmental pharmacokinetic parameters were estimated using non-compartmental methods using WinNonlin® Professional Network Edition, Version 6.2.1 (Pharsight Corp, St Louis, MO, USA): maximum serum concentration Cmax, time of Cmax tmax, area under the serum concentration–time curve from time zero to the last quantifiable concentration AUC(0,t), AUC from time from zero to infinity AUC(0,∞), serum half-life t1/2, apparent volume of distribution V/F and apparent clearance CL/F.
Safety assessments
Safety was assessed by AEs, serious AEs (SAEs), AEs leading to discontinuation and death, clinical laboratory tests, marked laboratory abnormalities, vital signs, physical measurements and ECGs. All AEs were coded to system organ class (SOC) and preferred term (PT) using the Medical Dictionary for Regulatory Activities and presented by subject in the data listings. Adverse events were listed and tabulated by SOC, PT and renal function group. An AE was classified as treatment-emergent if it was not present prior to dosing of study drug, but occurred after the start of study drug, or if it existed prior to dosing, it had an increased intensity after initiation of study drug. Only treatment-emergent AEs (TEAEs) were summarized.
Statistical methods
Sample size
The sample size was not based on statistical power for formal hypothesis testing. The number of 12 subjects for the normal renal function group (group 1) was selected because data from 12 otherwise healthy subjects were to provide 80% probability for the 90% CI of the geometric means (GMs) for Lambda AUC to be within –32.4% and +47.8% of the point estimate, while for the impaired renal function groups (Groups 2 to 5) data from eight subjects were to provide 80% probability for the 90% CI of the GM for Lambda AUC to have been within –40.4% and +67.9% of the point estimate. This calculation was based on the assumption that Lambda AUC was log normally distributed with an intersubject CV% of 0.73, as estimated from data reported previously [19].
Pharmacokinetic evaluations
Lambda serum concentrations were summarized by time and renal function group. Pharmacokinetic parameter estimates were summarized by treatment group: To investigate the relationship between Lambda PK and renal function, a simple linear regression analysis was performed on loge-transformed values of Lambda AUC(0,t), AUC(0,∞), Cmax,, V/F and CL/F with baseline (day –1) estimated CLcr determined by the Cockcroft–Gault equation as the independent variable. Non-HD subjects from groups 1 to 4 were included in the analysis. Residual plots from this model were constructed to evaluate the validity of model assumptions. If a linear relationship appeared inappropriate, alternative models were to be explored. Point estimates and 95% confidence intervals (CIs) of the intercept and slope are presented. A general linear model was fitted on loge-transformed values of Lambda AUC(0,t), AUC(0,∞) and Cmax,, with renal function group as a fixed effect. Point estimates and 90% CIs for renal function group differences on the loge scale were exponentiated to obtain estimates for ratios of GMs on the original scale. Each renal dysfunction group (groups 2 to 5) was compared with the normal renal function group (group 1).
Immunogenicity
Antibody response to Lambda was listed and summarized descriptively by collection timepoint. Subjects were considered to have a positive antibody response to Lambda if any of the following conditions were met: 1) a negative laboratory-reported baseline immunogenicity response and a positive laboratory-reported immunogenicity response at a post-dose timepoint or 2) a positive laboratory-reported baseline immunogenicity response and a five-fold or greater increase in titre at a post-dose timepoint. The number and frequency of subjects with positive antibody responses were summarized.
Safety
The total number of AEs was summarized. The incidence of AEs was summarized with counts and percentages by SOC, PT and renal function group, by PT and renal function group, by SOC, PT, maximum intensity and renal function group, by SOC, PT, maximum intensity and renal function group, for related TEAEs, by SOC, PT, maximum intensity and renal function group, for non-related TEAEs and by SOC, PT and renal function group for AEs leading to study discontinuation. For the incidence by SOC and PT, if a subject experienced more than one event within the same SOC and PT, only one occurrence was included in the incidence. For the incidence by SOC, PT and intensity, if a subject experienced more than one event within the same SOC and PT, only the most severe occurrence was included in the incidence. Observed values and change from baseline of continuous laboratory parameters (haematology, chemistry and urinalysis) were listed and summarized descriptively by renal function group and study day. Observed values and change from baseline of vital signs were summarized descriptively by renal function group and study day. Observed values and change from baseline of 12-lead ECG parameters were summarized by renal function group and study day.
Results
Subjects
Twelve subjects were dosed in group 1, eight subjects were dosed in each of groups 2, 3 and 5 and seven subjects were dosed in group 4 for a total of 43 subjects dosed in the study. All 43 subjects (100.0%) completed the study. All subjects in the ESRD group were on HD and four of these subjects were anuric. The aetiologies of renal insufficiencies in the subjects in groups 2 to 5 were hypertension and/or diabetes, as all subjects in groups 3 to 5 presented with either one or both conditions, while three subjects in group 2 had either or both of these clinical conditions. The five other subjects in group 2 did not have notable past medical histories contributing to renal insufficiency, but were in the age range of 58 to 71 years. Subject baseline characteristics are summarized in Table 1.
Pharmacokinetics
The mean concentration–time profiles showed that serum concentrations of Lambda increased with decreasing renal function. The elimination profile of Lambda appeared to be biphasic for all renal function groups. Following a single dose of Lambda, the serum concentrations were quantifiable up to 240 h for subjects with normal renal function and up to 408 h in subjects with renal dysfunction (Figure1).
Figure 1.
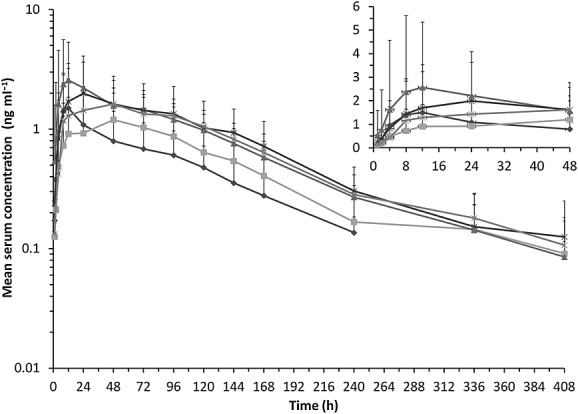
Lambda mean (+ SD) serum concentration vs. time plot following single dose Lambda 180 µg s.c. administration to subjects with normal renal function and subjects with varying degrees of renal impairment (RI). normal;
 mild RI;
 moderate RI;
 severe RI;
 ESRD
ESRD
The median time to Cmax appeared to be shorter in the normal group (12 h) compared with the renal impaired groups (range 30 to 48 h). However, the variability in the tmax was quite high (range 8 to 144 h) across the treatment groups. On average, the mean t1/2 estimates of Lambda were similar in the normal, mild, moderate and severe groups, while up to approximately 32% longer in subjects with ESRD. The CL/F of Lambda was similar in the mild group compared with the normal group, while it was decreased in the other renal function groups. On average, the V/F was decreased in the renal dysfunction groups compared with the normal group (Table 2).
Table 2.
Summary PK parameters following single dose Lambda 180 µg s.c. administration to subjects with normal and varying degrees of renal impairment (RI)
| Pharmacokinetic parameters[Geometric mean(%CV)] | |||||||
|---|---|---|---|---|---|---|---|
| RI | Cmax | tmax* | AUC(0,t) | AUC(0,∞) | t1/2† | CL/F | V/F |
| group | (ng ml–1) | (h) | (ng ml–1h) | (ng ml–1h) | (h) | (ml min–1) | (l) |
| Normal | 1.00 | 12.0 | 99.5 | 131‡ | 63.4‡ | 22.9‡ | 129‡ |
| (n = 12) | (109) | (8.0–120.0) | (65) | (52) | (14.3) | (43) | (56) |
| Mild RI | 1.10 | 48.0 | 125 | 157§ | 53.8§ | 19.1§ | 84.0§ |
| (n = 8) | (59) | (12.0–72.0) | (65) | (55) | (19.4) | (55) | (48) |
| Moderate RI | 2.10 | 30.0 | 238 | 256 | 54.9 | 11.7 | 53.7 |
| (n = 8) | (101) | (8.0–144.0) | (40) | (37) | (14.9) | (40) | (59) |
| Severe RI | 1.40 | 48.0 | 161 | 256¶ | 53.5¶ | 11.7¶ | 52.7¶ |
| (n = 7) | (81) | (12.0–96.0) | (74) | (55) | (15.1) | (69) | (56) |
| ESRD | 1.60 | 48.0 | 233 | 247 | 70.0 | 12.1 | 69.6 |
| (n = 8) | (35) | (8.0–72.0) | (33) | (31) | (23.7) | (41) | (56) |
Median (min–max);
Mean (SD);
n = 11;
n = 7;
n = 6.
Linear regression analysis indicated that the loge-transformed values of Lambda Cmax and AUC generally increased with decreasing eGFR. There was a decrease in both CL/F and V/F with decreasing eGFR (Figure2).
Figure 2.
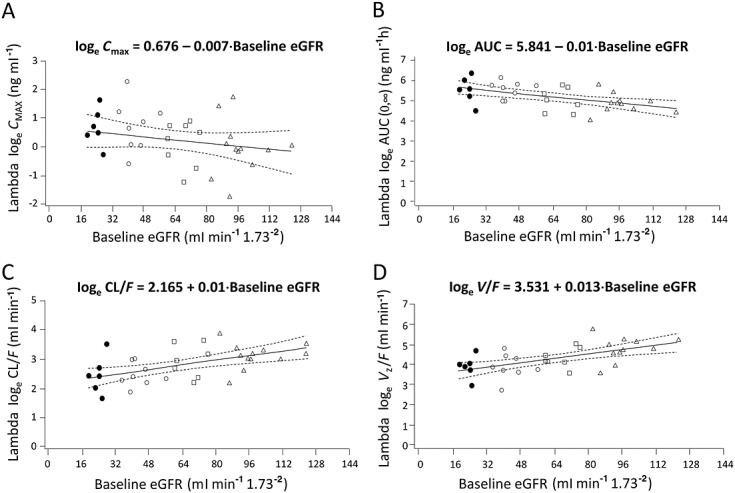
Linear regression analyses of Lambda (A) CMAX, (B) AUC, (C) CL/F and (D) V/F vs. baseline eGFR following single dose Lambda 180 µg s.c. administration.△normal renal function; □ mild RI; ◯ moderate RI; • severe RI
On average, following a single dose of Lambda, the Cmax and AUC of Lambda were only 13% and 20% greater, respectively, in the mild group compared with the normal group, whereas they were greater (37% to 109% for Cmax and 88% to 95% for AUC) for all other renal dysfunction groups compared with the normal group. The exposures were comparable among the moderate, severe and ESRD groups. On average, the CL/F and V/F were lower for all renal dysfunction groups compared with the normal group. The decrease in CL/F and V/F was only 17% and 35%, respectively, in the mild group compared with the normal group. However, the decrease in the moderate, severe and ESRD groups was greater and ranged from 47% to 49% for CL/F and 46% to 59% for V/F compared with the normal group (Table 3).
Table 3.
Statistical analysis of Lambda PK parameters comparing renal dysfunction groups with the normal group following single dose Lambda 180 µg s.c. administration
| Ratio of adjusted geometric mean(90%confidence interval) | |||||
|---|---|---|---|---|---|
| Renal impairment group vs.normal renal function | Cmax | AUC(0,t) | AUC(0,∞) | CL/F | V/F |
| Mild renal impairment | 1.13 | 1.25 | 1.20 | 0.83 | 0.65 |
| (0.58, 2.21) | (0.71, 2.21) | (0.82, 1.77) | (0.57, 1.23) | (0.41, 1.04) | |
| Moderate renal impairment | 2.09 | 2.39 | 1.95 | 0.51 | 0.42 |
| (1.07, 4.08) | (1.36, 4.22) | (1.35, 2.83) | (0.35, 0.74) | (0.27, 0.66) | |
| Severe renal impairment | 1.37 | 1.62 | 1.95 | 0.51 | 0.41 |
| (0.68, 2.75) | (0.90, 2.93) | (1.30, 2.93) | (0.34, 0.77) | (0.25, 0.67) | |
| ESRD | 1.60 | 2.34 | 1.88 | 0.53 | 0.54 |
| (0.82, 3.12) | (1.33, 4.14) | (1.30, 2.73) | (0.37, 0.77) | (0.35, 0.85) | |
Immunogenicity
Three subjects, one each in the normal, moderate and severe groups had an ADA response detected at baseline (pre-dose) and at all post-dose time points, but none of these subjects had a boosted response. For all of the other subjects, none had a detectable ADA response post-dosing. Therefore, no subject had a drug-induced positive antibody response.
Safety
There were no deaths, SAEs or AEs that led to subject discontinuations from the study. A total of 25 subjects (58.1%) reported 40 AEs. Overall, with the exception of the severe group (in which two subjects [28.6%] reported two AEs), the incidence of AEs and number of subjects reporting AEs was similar across treatments. The most commonly reported AEs were headache (5/43, 11.6%), hypertransaminasaemia (4/43, 9.3%), muscle spasms (4/43, 9.3%), injection site erythema (3/43; 7.0%), diarrhoea (2/43, 4.7%) and injection site pruritus (2/43, 4.7%). Thirteen subjects (30.2%) reported 18 AEs considered related to study drug. All but one AE were assessed as mild in intensity and no AEs were assessed as severe. One subject in the moderate group had an AE of muscle spasms that was assessed as moderate in intensity and considered not related to study drug. All AEs resolved without sequelae. Four subjects with markedly abnormal ALT and/or AST values had elevations reported as AEs of hypertransaminasaemia that were considered mild in intensity and related to study drug. The subjects’ elevated ALT and/or AST values returned to within normal ranges between days 10 and 29. One subject had an AE of increased creatine phosphokinase (CPK) that was considered mild in intensity and not related to study drug. There were no other clinically relevant laboratory findings or clinically relevant trends from baseline for laboratory assessments. No ECG parameter abnormalities were considered clinically significant by the investigators. While some of the subjects had ECG parameters that met prespecified criteria for QT and QTcF interval prolongation, the changes were considered by the investigators to be consistent with the degree of renal impairment. The majority of ECG findings were identified in subjects in the moderate, severe and ESRD groups.
Discussion
This study demonstrated that following single dose administration of Lambda 180 µg, Cmax and AUC increased with decreasing eGFR. The increase in Lambda exposures were observed across all of the renal dysfunction groups compared with the normal group. In the mild group, the increases in exposures (only 13% for Cmax and 20% for AUC and the 90% CI included 1) were considered only slightly greater compared with the normal group. The effects on exposures in subjects with eGFR < 60 ml min–1 1.73 m–2 in the moderate, severe and ESRD groups were comparable across groups, with a range of increases of Lambda Cmax and AUC from 37% to 109% and approximately 88% to 95%, respectively. It should be noted that on average, the mean half-life estimates of Lambda were similar in the normal, mild, moderate and severe groups, while up to approximately 32% longer in subjects with ESRD. The exposure estimates of AUC were increased, while half-life estimates were relatively similar across groups, which could be due to the previously observed flip-flop pharmacokinetics for Lambda [7].
At the outset of the study, the effects of renal dysfunction on the PK of Lambda were expected to be similar to two other pegylated IFNs used in the treatment of HCV, peginterferon alfa-2a [15] and peginterferon alfa-2b [16], because of the relatively similar molecular weight of Lambda. The current results were largely consistent, but there were slight differences in the effects of moderate renal impairment. As with the other pegylated IFNs, mild renal dysfunction did not appear to have a clinically significant impact on Lambda exposure. When comparing the PK parameter point estimates across the renal impairment groups, the exposure point estimates for CL/F were similar across the moderate, severe and ESRD groups, whereas for peginterferon alfa-2b and peginterferon alfa-2a, the estimates for moderate and severe renal insufficiency groups were different. For example, the mean CL/F estimate for Lambda were reduced by approximately 49% in the moderate group vs. normal group, while for peginterferon alfa-2a and peginterferon alfa-2b, the reduction was approximately 20% [15] and 37% [16], respectively, in subjects with moderate renal insufficiency. For those with severe renal impairment, the results were similar for Lambda as for the other pegylated-IFNs, as the results demonstrated close to approximately a reduction of CL/F by about 50% for all compounds [15,16].
The linear regression analysis demonstrated decreasing CL/F with decreasing eGFR (Figure2C). It should also be noted that with the relatively high variability with Lambda exposure estimates, some of the subjects in the moderate group (30 ml min–1 to 50 ml min–1), had exposures similar to those in the mild group. Thus, it is possible that some subjects with eGFR in this range could maintain exposures in the mild/normal range and could be administered the 180 µg dose without dose adjustment, most likely patients with eGFR above 40 ml min–1. The regression analysis can be used to ascertain to what degree the amount of non-renal clearance accounts for the elimination of Lambda. While renal elimination is the predominant mechanism for therapeutic proteins in similar size and confirmation as Lambda, proteolysis in other tissues needs to be accounted for, as therapeutic proteins are metabolized via the same catabolic processes as endogenous and dietary proteins via ubiquitous proteolytic enzymes throughout the body [20]. Using the linear regression equation for CL/F (Figure2C) and by setting eGFR = 0, the predicted non-renal CL/F estimate is ∼8.71 ml min–1. The predicted CL/F when eGFR = 100 (normal renal function) is ∼ 23.7 ml min–1, which is similar to the geometric mean estimate of CL/F for the normal group (Table 2). Dividing the predicted CL/F estimate when eGFR = 0 by the clearance estimate at full renal function suggests that non-renal clearance is responsible for approximately 36.8% of Lambda elimination. Thus, the elimination of Lambda is not completely dependent on a renal mechanism and dose adjustments for subjects with varying degrees of renal insufficiency can be supported by using these regression analyses and through additional population PK analyses using the phase 2/3 data.
Because Lambda is a pegylated protein, the metabolic fate of PEG could also be considered. The majority of excretion data for PEG is derived from administration of forms not conjugated to proteins. In the unconjugated forms, PEG molecules up to and including 190 kDa are primarily eliminated via urinary excretion [12,13]. Currently, no data exist on the excretion of PEG when conjugated with proteins. Because of the size of the PEG molecules used for parenteral administration, it is assumed that urinary excretion would be a major route of elimination [13]. Because both the protein and PEG portions of Lambda are primarily renally eliminated, it is possible that PEG clearance could also be slowed in subjects with renal impairment. However, the fate of the linear PEG portion in this study can only be postulated, as the bioanalytical methods used here detected the complete 40 kDa molecule.
The current FDA draft guidance for PK studies in renal impairment states that renal impairment decreased the renal clearance of cytokines or cytokine modulators that have a molecular weight less than 69 kDa, and therefore, renal impairment studies are recommended for this class of therapeutic proteins during their development. Thus, it is of interest to compare the current study results with results of other similarly sized protein therapeutics. When peginterferon beta-1a, which has a molecular weight of ∼ 44 kDa, was administered as a single dose to subjects with varying degrees of renal insufficiency, exposures were marginally increased with decreased renal function [21]. In that study, as with the current study results, exposure point estimates for the moderate and severe renal impairment groups were similar to one another. Interestingly, the exposures of albiglutide, a protein linked to albumin with approximate size of 73 kDa, were modestly (up to ∼40%) increased in moderate and severe groups vs. normal volunteers [22]. This molecule has a molecular weight that is greater than the cutoff identified by the draft FDA guidance, but shows effects of renal impairment of clearance. Conversely, following single dose administration, pegfilgrastim, which has a molecular weight of approximately 38.8 kDa, the pharmacokinetics and pharmacodynamics of the molecule were not affected [23]. Following a single dose of palifermin, a protein with a molecular weight of 16.3 kDa, clearance estimates were similar between mild and moderate renal impairment with a slight decrease in point estimate for the severe and ESRD groups, but the exposures were relatively similar, resulting in no dose adjustments due to renal impairment status [24]. Overall, the results of the current study and the literature demonstrate that the size of the protein is not a sole determinant of the effect of renal impairment on the elimination of the molecule, but other aspects, such as molecular confirmation and charge should be considered when determining the conduct of renal impairment studies.
In conclusion, these data collectively suggest that following single dose Lambda administration, mild impairment appears to slightly increase exposure, but may not be clinically significant, while subjects with moderate and severe renal insufficiency and ESRD had approximately two-fold increases in exposures. These results suggest that subjects with mild renal impairment could use the same dosing regimen as subjects with normal renal function. Similarly to the other pegylated IFNs used to treat HCV, patients with moderate to severe renal impairment and ESRD most likely would require dose modifications of Lambda.
Competing Interests
All authors have completed the Unified Competing Interest form at http://www.icmje.org/coi_disclosure.pdf (available on request from the corresponding author). All authors were employees and/or stockholders of Bristol-Myers Squibb at the time the study was conducted and data were analyzed and interpreted.
The authors would like to gratefully acknowledge Dr Thomas C. Marbury, MD, Dr William B. Smith, MD, FACC, Dr Kenneth C. Lasseter, MD, the staff at Orlando Clinical Research, Orlando, FL, USA, New Orleans Center for Clinical Research, Knoxville, TN, USA, and Clinical Pharmacology of Miami, Inc. Miami, FL, USA, ICON Development Solutions, LLC, and the study participants.
References
- 1.Sheppard P, Kindsvogel W, Xu W, Henderson K, Schlutsmeyer S, Whitmore TE, Kuestner R, Garrigues U, Birks C, Roraback J, Ostrander C, Dong D, Shin J, Presnell S, Fox B, Haldeman B, Cooper E, Taft D, Gilbert T, Grant FJ, Tackett M, Krivan W, McKnight G, Clegg C, Foster D, Klucher KM. IL-28, IL-29 and their class II cytokine receptor IL-28R. Nat Immunol. 2003;4:63–8. doi: 10.1038/ni873. [DOI] [PubMed] [Google Scholar]
- 2.Kotenko SV, Gallagher G, Baurin VV, Lewis-Antes A, Shen M, Shah NK, Langer JA, Sheikh F, Dickensheets H, Donnelly RP. IFN-lambdas mediate antiviral protection through a distinct class II cytokine receptor complex. Nat Immunol. 2003;4:69–77. doi: 10.1038/ni875. [DOI] [PubMed] [Google Scholar]
- 3.Robek MD, Boyd BS, Chisari FV. Lambda interferon inhibits hepatitis B and C virus replication. J Virol. 2005;79:3851–4. doi: 10.1128/JVI.79.6.3851-3854.2005. [DOI] [PMC free article] [PubMed] [Google Scholar]
- 4.Doyle SE, Schreckhise H, Khuu-Duong K, Henderson K, Rosler R, Storey H, Yao L, Liu H, Barahmand-pour F, Sivakumar P, Chan C, Birks C, Foster D, Clegg CH, Wietzke-Braun P, Mihm S, Klucher KM. Interleukin-29 uses a type 1 interferon-like program to promote antiviral responses in human hepatocytes. Hepatology. 2006;44:896–906. doi: 10.1002/hep.21312. [DOI] [PubMed] [Google Scholar]
- 5.Sommereyns C, Paul S, Staeheli P, Michiels T. IFN-lambda (IFN-lambda) is expressed in a tissue-dependent fashion and primarily acts on epithelial cells in vivo. PLoS Pathog. 2008;4:e1000017. doi: 10.1371/journal.ppat.1000017. [DOI] [PMC free article] [PubMed] [Google Scholar]
- 6.Friborg J, Levine S, Chen C, Sheaffer AK, Chaniewski S, Voss S, Lemm JA, McPhee F. Combinations of lambda interferon with direct-acting antiviral agents are highly efficient in suppressing hepatitis C virus replication. Antimicrob Agents Chemother. 2013;57:1312–22. doi: 10.1128/AAC.02239-12. [DOI] [PMC free article] [PubMed] [Google Scholar]
- 7.Wang X, Hruska M, Chan P, Ahmad A, Freeman J, Horga MA, Hillson J, Kansra V, Lopez-Talavera JC. Derivation of Phase 3 dosing for peginterferon lambda-1a in chronic hepatitis C, Part 1: Modeling optimal treatment duration and sustained virologic response rates. J Clin Pharmacol. 2015;55:63–72. doi: 10.1002/jcph.363. [DOI] [PubMed] [Google Scholar]
- 8.Meibohm B, Zhou HJ. Characterizing the impact of renal impairment on the clinical pharmacology of biologics. J Clin Pharmacol. 2012;52:54S–62. doi: 10.1177/0091270011413894. [DOI] [PubMed] [Google Scholar]
- 9.Bocci V, Pacini A, Muscettola M, Paulesu L, Pessina GP, Santiano M, Viano I. Renal filtration, absorption and catabolism of human alfa interferon. J Interferon Res. 1981;1:347–51. doi: 10.1089/jir.1981.1.347. [DOI] [PubMed] [Google Scholar]
- 10.Bino T, Edery H, Gertler A, Rosenberg H. Involvement of the kidney of catabolism of human leukocyte interferon. J Gen Virol. 1982;59:39–45. doi: 10.1099/0022-1317-59-1-39. [DOI] [PubMed] [Google Scholar]
- 11.Bino T, Madar Z, Gertler A, Rosenberg H. The kidney is the main site of interferon degradation. J Interferon Res. 1982;2:301–8. doi: 10.1089/jir.1982.2.301. [DOI] [PubMed] [Google Scholar]
- 12.Webster R, Elliott V, Park BK, Walker D, Hankin M. PEGylated Protein Drugs: Basic Science and Clinical Applications. Drug Therapy: In Milestones in; 2009. Taupin P. PEG and PEG conjugates toxicity: towards an understanding of the toxicity of PEG and its relevance to PEGylated biologicals. pp 127–46. [Google Scholar]
- 13.Webster R, Didier E, Harris P, Siegel N, Stadler J, Tilbury L, Smith D. PEGylated proteins: evaluation of their safety in the absence of definitive metabolism studies. Drug Metab Dispos. 2007;35:9–16. doi: 10.1124/dmd.106.012419. [DOI] [PubMed] [Google Scholar]
- 14. Guidance for Industry Pharmacokinetics in Patients with Impaired Renal Function — Study Design, Data Analysis, and Impact on Dosing and Labeling. Available at http://www.fda.gov/downloads/Drugs/Guidances/UCM204959.pdf (last accessed 6 October 2014)
- 15. United States Food and Drug Administration Clinical Pharmacology Review of Peg interferon alfa-2a (Ro25-8310, PEGASYS). (FDA Web site) Available at http://www.fda.gov/downloads/Drugs/DevelopmentApprovalProcess/HowDrugsareDevelopedandApproved/ApprovalApplications/TherapeuticBiologicApplications/ucm094466.pdf (last accessed 6 October 2014)
- 16.Gupta SK, Pittenger AL, Swan SK, Marbury TC, Tobillo E, Batra V, Sack M, Glue P, Jacobs S, Affrime M. Single-dose pharmacokinetics and safety of pegylated interferon-2b in patients with chronic renal dysfunction. J Clin Pharmacol. 2002;42:1109–15. doi: 10.1177/009127002401382713. [DOI] [PubMed] [Google Scholar]
- 17.Stevens LA, Coresh J, Feldman HI, Greene T, Lash JP, Nelson RG, Rahman M, Deysher AE, Zhang YL, Schmid CH, Levey AS. Evaluation of the Modification of Diet in Renal Disease Study equation in a large diverse population. J Am Soc Nephrol. 2007;18:2749–57. doi: 10.1681/ASN.2007020199. [DOI] [PubMed] [Google Scholar]
- 18.Myler H, Felix T, Zhu J, Hruska M, Piccoli SP. Measuring biotherapeutics with endogenous counterparts and pre-existing antibodies: an interferon case study. Bioanalysis. 2014;6:1113–22. doi: 10.4155/bio.14.37. [DOI] [PubMed] [Google Scholar]
- 19.Byrnes-Blake KA, Freeman JA, Rapalus L, Pederson S, Fontana D, Lopez-Talavera JC, Kansra V, Miller DM. Pharmacokinetics of PEG-interferon lambda (PEG-IFN-l) following fixed dosing in treatment-naive hepatitis C subjects (single dose interim data from a dose-ranging phase 2a study) Hepatology. 2010;52:720–1A. [abstract 880]. Poster available at http://trs.scivee.tv/node/2041 (last accessed 10 February 2015) [Google Scholar]
- 20.Tang L, Persky AM, Hochhaus G, Meibohm B. Pharmacokinetic aspects of biotechnology products. J Pharm Sci. 2004;93:2184–204. doi: 10.1002/jps.20125. [DOI] [PubMed] [Google Scholar]
- 21.Hu X, Seddighzadeh A, Stecher S, Zhu Y, Goyal J, Matson M, Marbury T, Smith W, Nestorov I, Hung S. Pharmacokinetics, pharmacodynamics, and safety of peginterferon beta-1a in subjects with normal or impaired renal function. J Clin Pharmacol. 2015;55:179–88. doi: 10.1002/jcph.390. [DOI] [PMC free article] [PubMed] [Google Scholar]
- 22.Young MA, Wald JA, Matthews JE, Yang F, Reinhardt RR. Effect of renal impairment on the pharmacokinetics, efficacy, and safety of albiglutide. Postgrad Med. 2014;126:35–46. doi: 10.3810/pgm.2014.05.2754. [DOI] [PubMed] [Google Scholar]
- 23.Yang BB, Kido A, Salfi M, Swan S, Sullivan JT. Pharmacokinetics and pharmacodynamics of pegfilgrastim in subjects with various degrees of renal function. J Clin Pharmacol. 2008;48:1025–31. doi: 10.1177/0091270008320318. [DOI] [PubMed] [Google Scholar]
- 24.Gillespie B, Zia-Amirhosseini P, Salfi M, Kakkar T, Wang J, Gupta S, Smith B, Robson R, Sullivan JT. Effect of renal function on the pharmacokinetics of palifermin. J Clin Pharmacol. 2006;46:1460–8. doi: 10.1177/0091270006292705. [DOI] [PubMed] [Google Scholar]