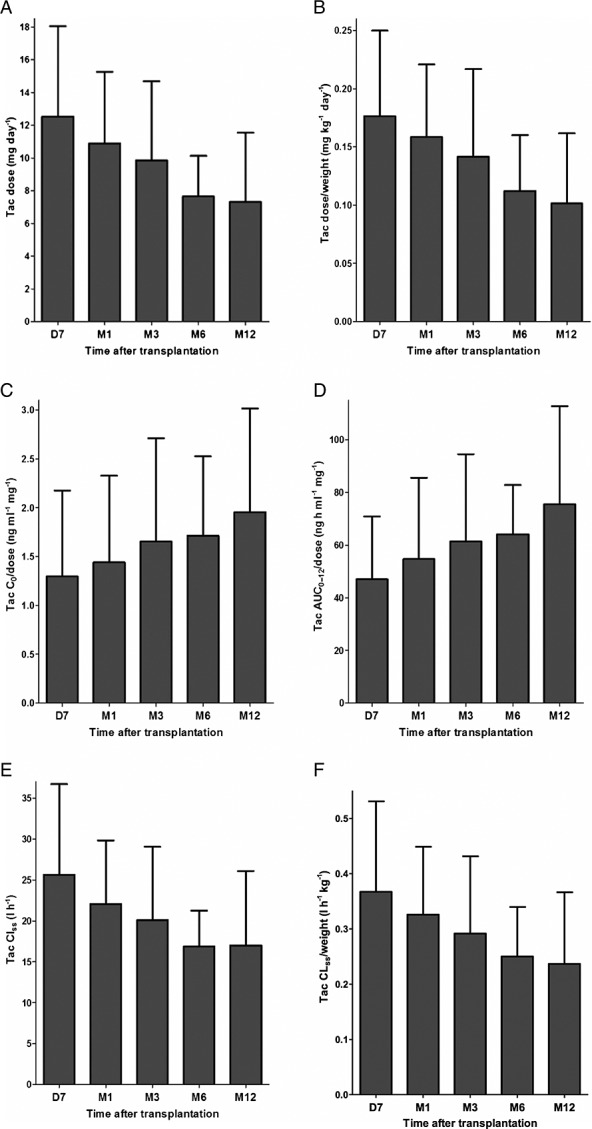
Figure 2.

The first three panels show (weight-corrected) tacrolimus (Tac) dose requirements (A), dose-corrected Tac tacrolimus predose trough level (C0) and dose-interval area under the concentration–time curve (AUC0–12) (B) and (weight-corrected) Tac steady-state clearance (CLss) over time (C). The final three panels show the evolution of (weight-corrected) Tac dose requirements (D), dose-corrected Tac C0 and AUC0–12 (E) and (weight-corrected) Tac CLss over time (F) in all Tac-treated patients. The various Tac pharmacokinetic parameters are expressed as mean ± standard deviation
