
Figure 1. Task design and example licking behavior.
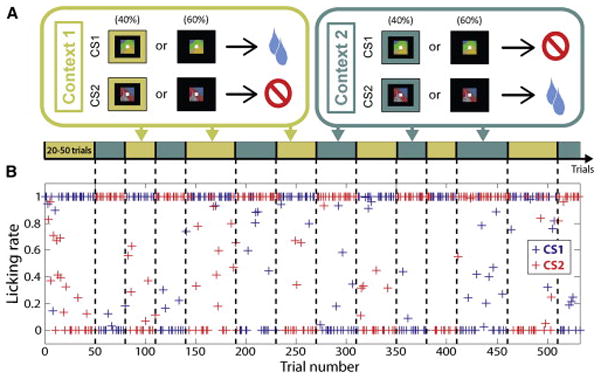
(A) Task design (see Experimental Procedures). (B) Licking rate (defined as the proportion of time spent licking during the last 500ms of the trace interval) as a function of trial number throughout an example of experimental session. CS1 is paired with reward in Context 1 and paired with no reward in Context 2. Block transitions are indicated by vertical dashed lines and the context in effect for each block is indicated by the diagram in (A).