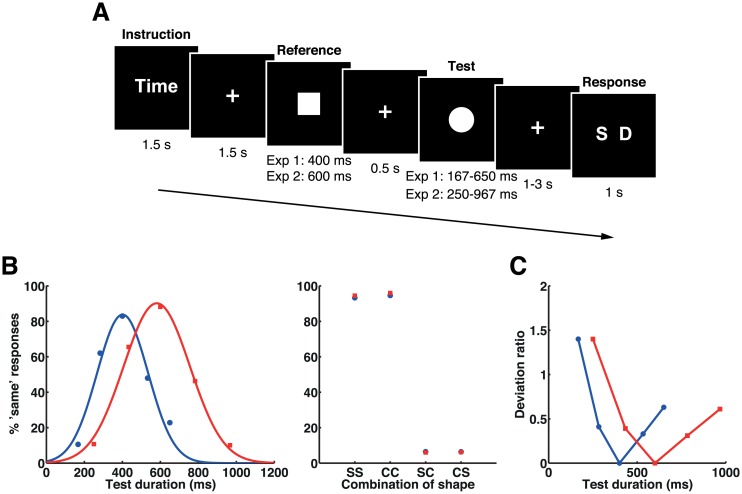
Fig 1. Stimulus sequence, mean task performances, and deviation ratios in experiments 1 and 2.
(A) The stimulus sequence. Participants were asked to respond with whether the durations of two sequentially presented visual stimuli were the same or different in the time task and whether the shapes of the two stimuli were the same or different in the shape task. (B) Mean task performances in experiments 1 (blue) and 2 (red). Proportions of the “same” responses for the time task were fitted by Gaussian functions for presentation purpose (left). The proportion of the “same” response for the shape task is shown for each combination of reference and test shapes (right). Letters on the x-axes represent combinations of shapes for reference and test stimuli: square-square (SS), circle-circle (CC), square-circle (SC), and circle-square (CS). Please refer to S1 Data for the numerical values underlying these figures. (C) Plots of deviation ratios for each set of stimulus durations in experiments 1 (blue) and 2 (red).

