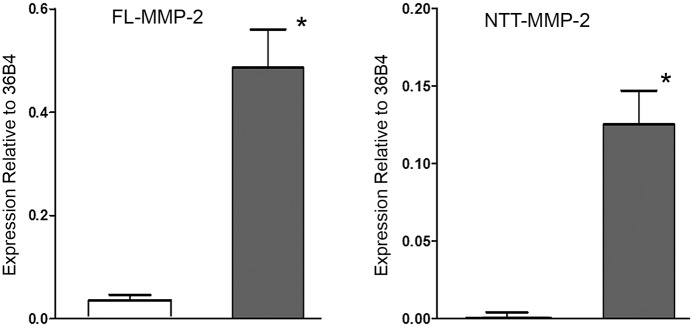
Fig 9. qPCR measurement of FL-MMP-2 and NTT-MMP-2 transcript abundance in control protocol biopsies and DGF biopsies.

mRNA was extracted from paraffin-embedded formalin-fixed renal biopsy specimens and FL-MMP-2 and NTT-MMP-2 transcript abundance was determined by qPCR as detailed in Materials and Methods. Both isoforms were normalized to a ribosomal protein, 36B4. There was a low, but detectable level of FL-MMP-2 transcript in the control protocol biopsies, consistent with the level of FL-MMP-2 immunohistochemical staining shown in Fig 2. FL-MMP-2 transcript abundance was increased approximately twelve-fold in the DGF samples. NTT-MMP-2 transcript abundance was nearly undetectable in the control protocol biopsies, consistent with the absence of NTT-MMP-2 immunohistochemical staining in controls (Fig 2). In contrast, NTT-MMP-2 transcripts were readily detectable in the DGF biopsies (* p<0.01).
