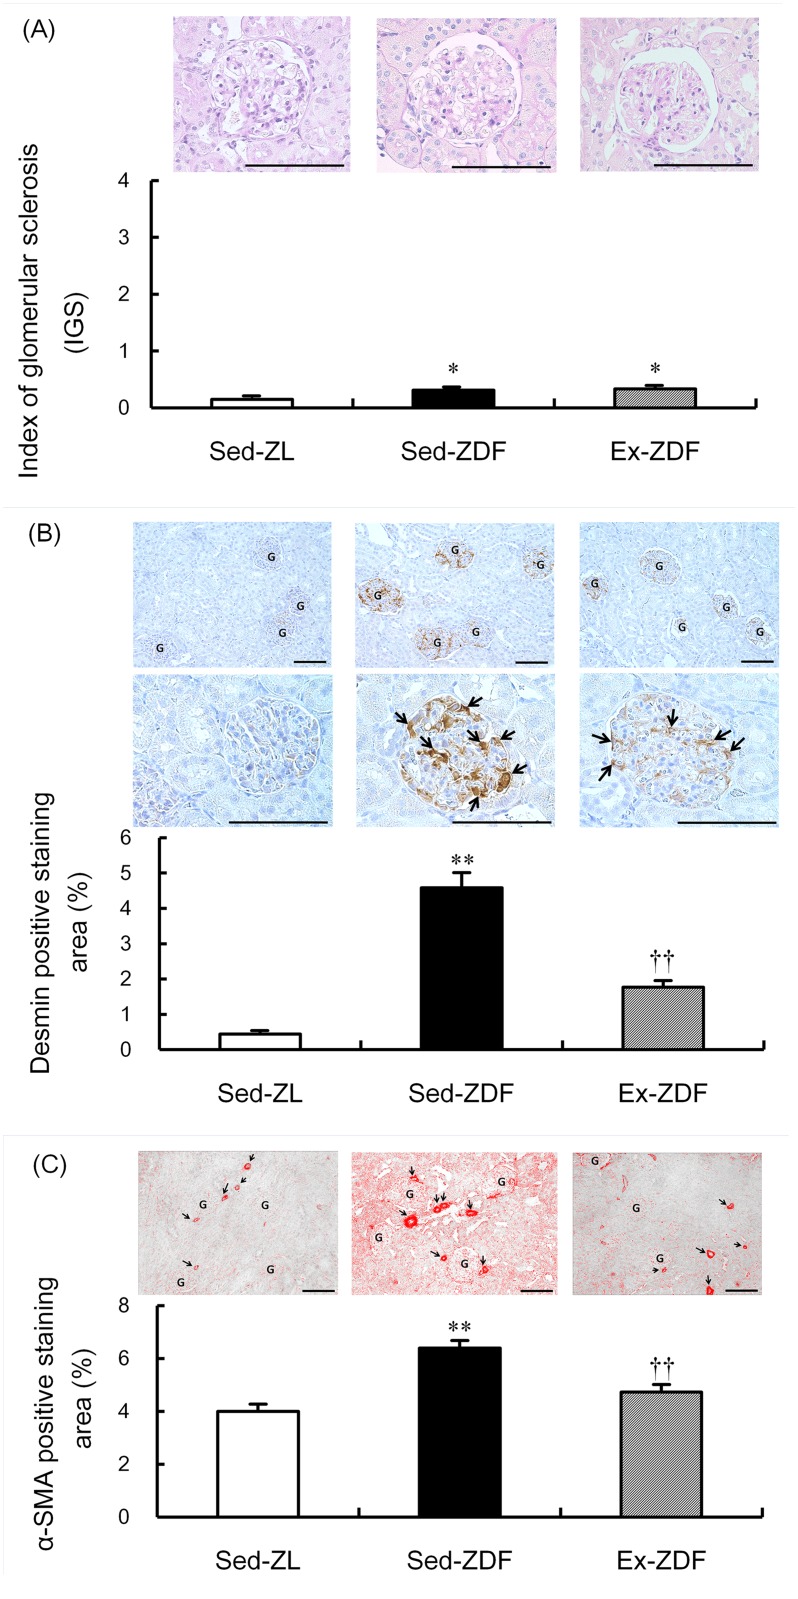
Fig 9. Effects of chronic running exercise on glomerulosclerosis, podocyte injury and tubulointerstitial injury in Zucker diabetic fatty rats.
(A) Index of glomerular sclerosis (IGS) was evaluated by Periodic acid-Schiff (PAS) staining in sedentary lean Zucker diabetic fatty (ZDF) rats (Sed-ZL), sedentary ZDF rats (Sed-ZDF) and aerobic treadmill exercised ZDF rats (Ex-ZDF) groups. Upper panels show representative images of renal cortex specimens stained with PAS from the different groups. Original magnification ×200. Scale bar = 100 μm. IGS was determined by grading (0–4) and graphs indicate IGS scores. (B) Podocyte injury was determined by desmin immunostaining of glomeruli in Sed-ZL, Sed-ZDF and Ex-ZDF groups. Top and middle panels show representative images of renal cortex specimens stained with desmin from the different groups. Original magnification ×200 (top), and ×400 (middle). Scale bar = 100 μm. Strongly positive staining regions were observed in glomeruli of the Sed-ZDF group. G indicates a glomerulus in low magnification field (top) and the arrows indicate desmin positive cells such as damaged glomerular podocytes (middle). Graphs depict quantitative representation of desmin positive staining area. (C) Tubulointerstitial injury was determined by α-SMA immunostaining in Sed-ZL, Sed-ZDF and Ex-ZDF groups. Upper panels show representative images of renal cortex specimens stained with α-SMA from the different groups. Original magnification ×200. Scale bar = 100 μm. Strongly positive staining regions were observed in the tubulointerstitium of the Sed-ZDF group. G indicates a glomerulus and the arrows indicate arteries and arterioles with strong positive lesions. Graphs depict quantitative representation of the α-SMA positive staining area. Values are means ± SEM (n = 5/group). * p<0.05, ** p<0.01 compared with the Sed-ZL group; †† p<0.01 compared with the Sed-ZDF group.

