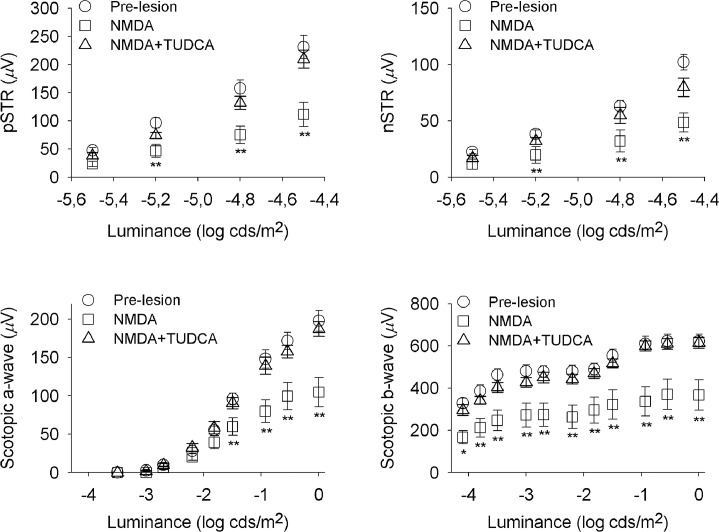
Fig 2. Effect of NMDA and TUDCA on the ERG intensity-response functions.
The graph represents mixed scotopic ERG amplitude (mean ± SEM) versus stimulus intensity previous to retinal damage (pre-lesion, circles, n = 11), and after NMDA-induced lesion in rats either treated with vehicle (NMDA, squares, n = 5) or TUDCA (NMDA+TUDCA, triangles, n = 6). Scotopic pSTRs, nSTRs, a-waves and b-waves recorded after retinal insult in TUDCA-treated rats reached higher values than those obtained in vehicle-administered animals. Asterisks indicate statistical significance (ANOVA, Bonferroni’s test), *P<0.05, **P<0.01.

