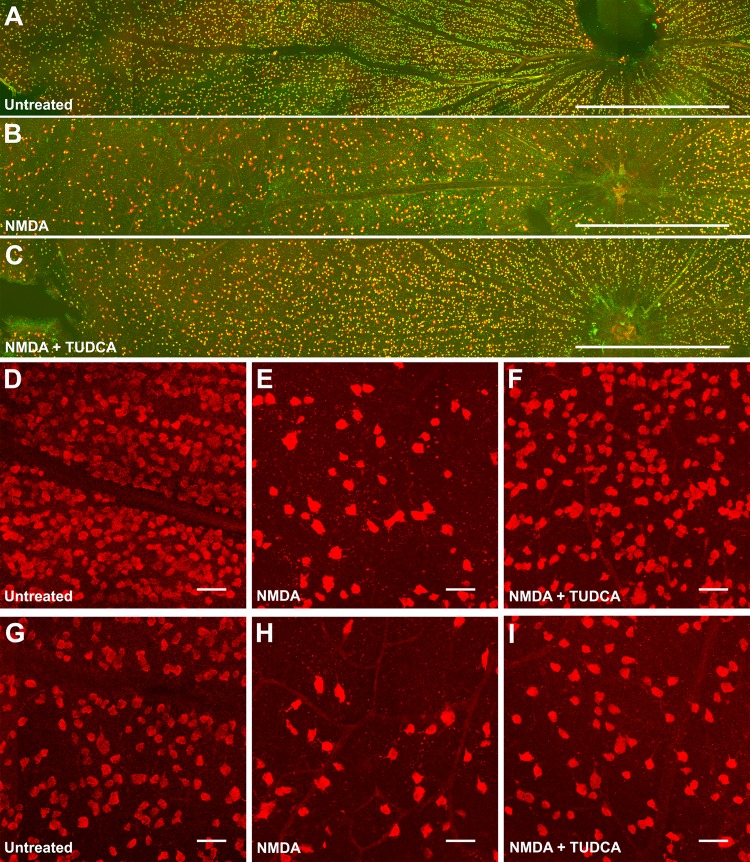
Fig 4. Immunohistochemical analysis of RGCs after NMDA-induced damage in the presence or absence of TUDCA.
Confocal images of whole-mounted retinas labelled with the RGC markers Brn3a (green) and RBPMS (red). A representative image of the dorsal area of the retina is shown for (A) untreated, (B) NMDA and (C) NMDA+TUDCA experimental groups. High magnification images (D-I) correspond to central (D-F) and peripheral (G-I) areas of the retina for the three experimental groups. Scale bar 1 mm (A-C), 50 μm (D-I).

