
Fig 2. Normalized population distributions for stable and malignant nodules as a function of the scan interval, ΔT.
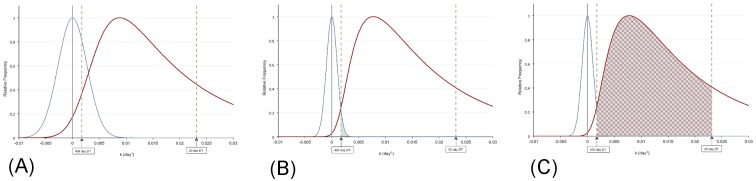
The stable nodules are described by a normal distribution centered at k = 0 zero and the malignant nodules are described by a lognormal distribution. (A) 30-day scan interval. (B and C) 81-day scan interval. Note the decrease in width of the distributions with a longer scan interval due to the effect of the scan interval time, ΔT, on the standard deviation for k as given by Eq 4 in the Appendix. In Fig 2B, FPR is computed as the percent area under the stable curve between the 400-day and 30-day doubling time values (0.00173<k<0.0231 day-1) (vertical dashed lines). In Fig 2C, TPR is computed as the percent area under the malignant curve between the same limits.