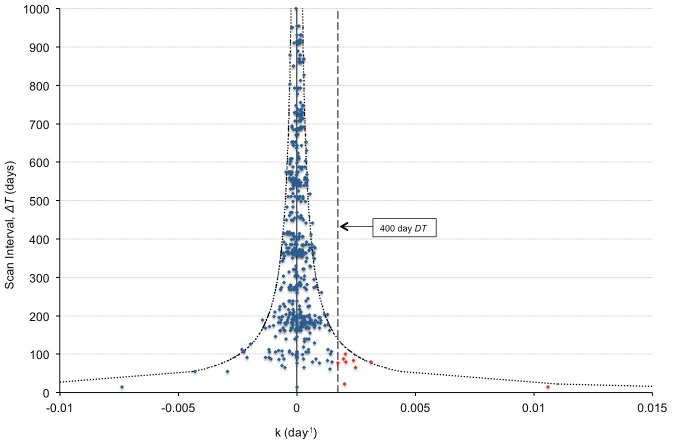
Fig 5. Plot of stable nodule k (growth rate) estimates for all non-calcified nodules as a function of scan interval, ΔT.
The estimated FPR is 1.6% (9/579), as computed by k > 0.00173 day-1 (i.e. DT<400 days) (horizontal dashed line). There were no false positive results for a scan interval greater than 100 days. Note the decreasing error in k with increasing scan interval time. The border curves (•••••) represent ±3σ k, as determined from Eq 4 in the Appendix, with a = 0.057 as calculated in Fig 3A.

