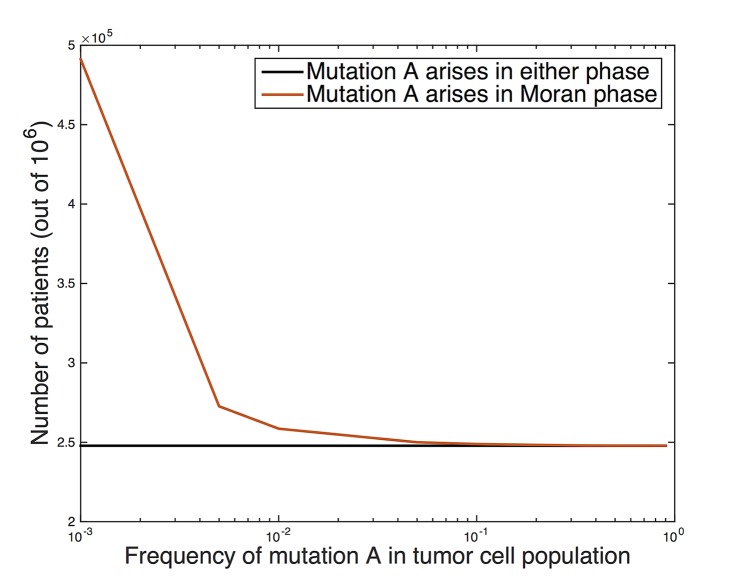
Fig 3. Number of patients out of 1 million samples in which cells with candidate mutation ‘A’ make up a threshold (x-axis) frequency in the ending tumor cell population.
(Black) all patients, (red) patients in which mutation A arose and reached fixation (i.e. 100% frequency) during the pre-initiation phase.

