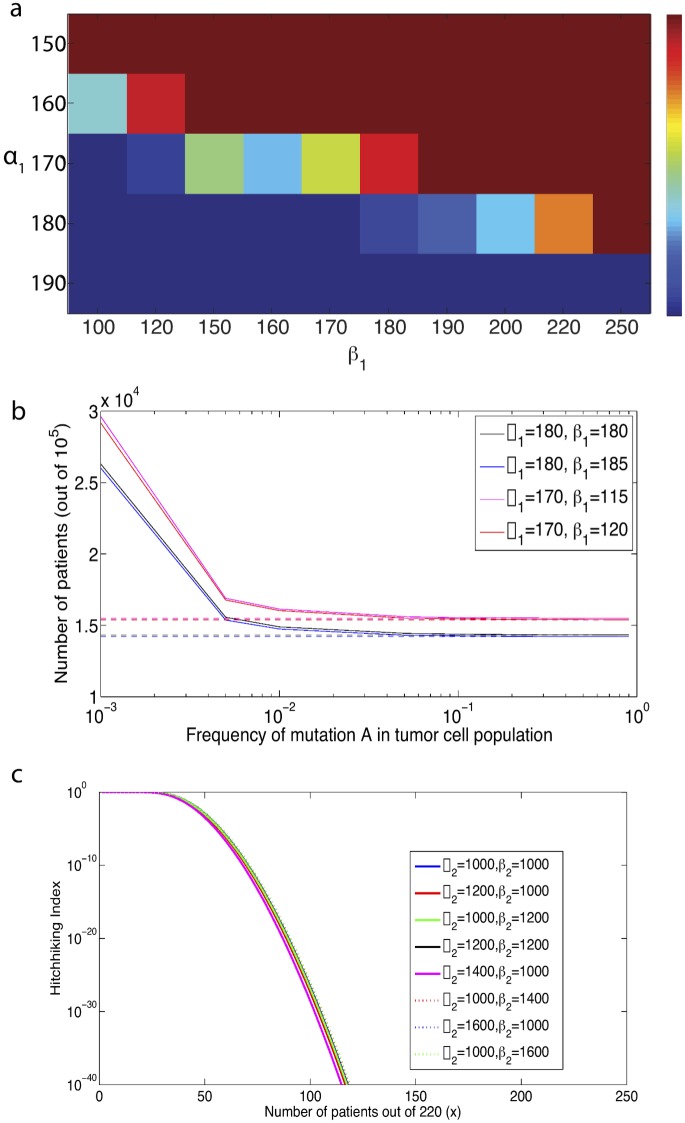
Fig 5. Sensitivity analyses for model predictions.
(a) Heatmap for the probability of initiation for a single crypt for ranges of parameters of α 1 and β 1. (b) Number of patients out of 100000 samples in which mutant A cells make up a threshold (x-axis) frequency in the ending tumor cell population, for variable shape parameters of the mutational fitness distribution (α 1,β 1). (Solid) All patients (Dashed) Patients in which mutation A arose and fixed during the pre-initiation phase. (c) Probability of detecting the passenger mutation in x out of 220 patients for a varying α 2, β 2.

