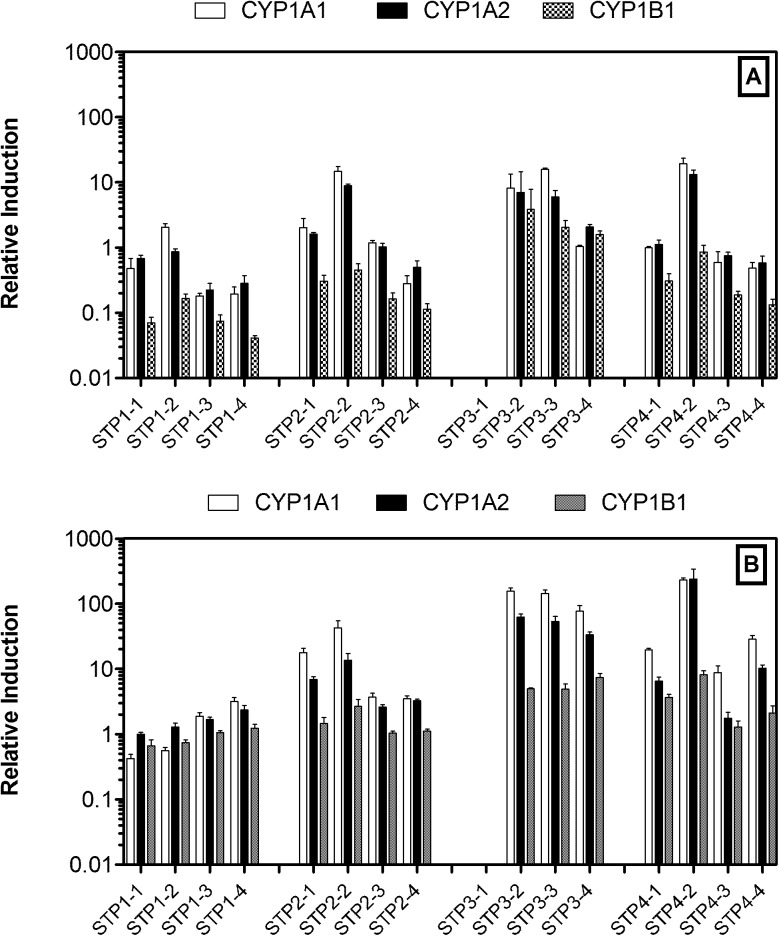
Fig 2. Comparison of CYP1 gene expression in rat hepatocytes exposed to wastewater extracts from STPs.
A: Pre-monsoon, B: Monsoon. Data are reported as means ± SD (standard deviation). STPx-y: x is the type of STP, y is the treatment step [equalization (step 1), aeration (step 2), settling (step 3), and outlet (step 4)]. The data for STP3-1 were not available.

