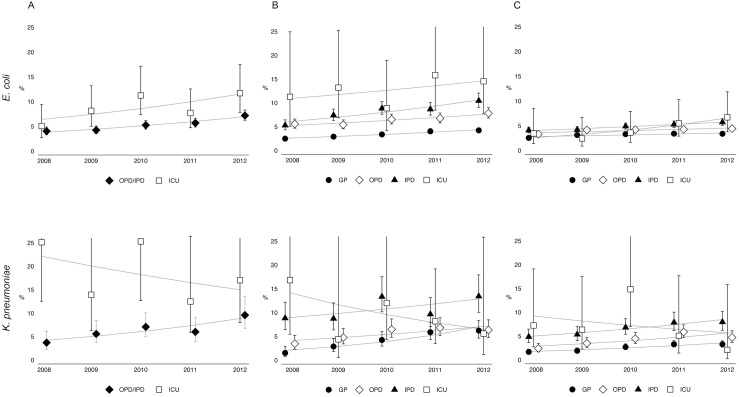
Fig 3. The proportion (in %) extended-spectrum cephalosporin-resistant Escherichia coli and Klebsiella pneumoniae isolates, for blood isolates (A), male urine isolates (B) and female urine isolates (C), per patient setting (general practitioner [GP], outpatient department [OPD], inpatient department [IPD] and intensive care units [ICU]), from 2008–2012, ISIS-AR, the Netherlands.
The point-estimates are generated with a generalized estimation equation (GEE) for log-binominal regression, including time in years, and patient characteristics, including age, gender, and geographic region. The error bars represent the 95% confident intervals of each of the point-estimates. To produce plots with comparable y-axis, the upper error bar is cut-off for some of the point-estimates.

