
Fig 5. eQTL (chr2:170783092:D) effect on the expression of the glutamate decarboxylase (GAD1) gene.
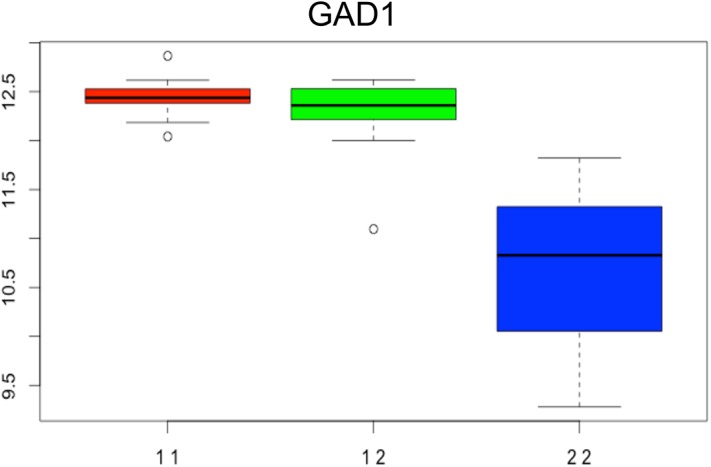
The bar plot depicts the differential expression of GAD1 among homozygote for the major (11, red), heterozygote (12, green) and homozygote for the minor alleles (22, blue) subjects.