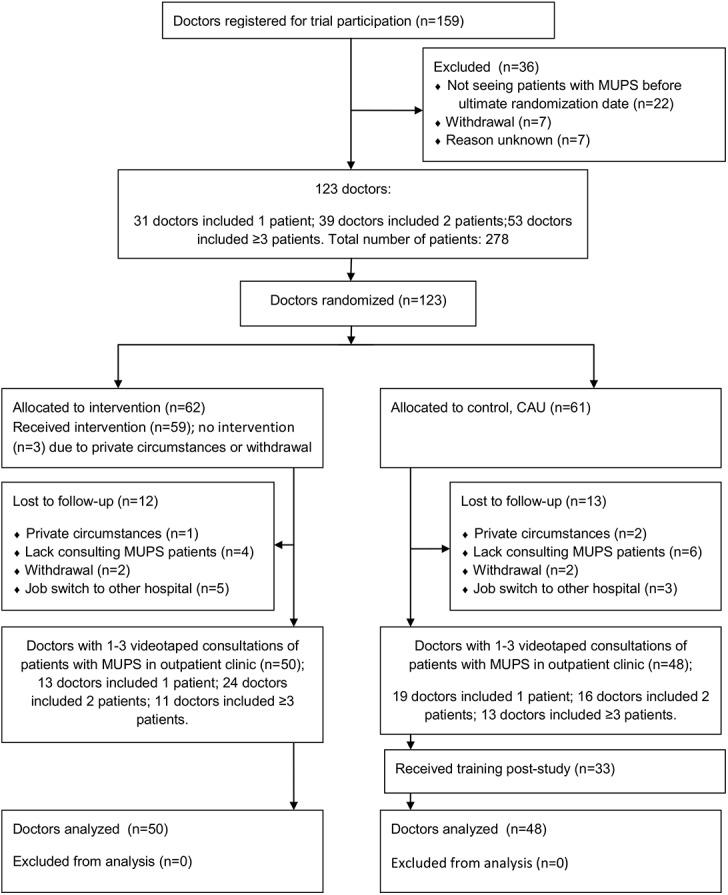
Fig 1. Consort Flow Chart.

This figure shows the amount of eligible and included doctors throughout the study accompanied by the amount of videotaped patients per doctor in pre-and post-measurements.

This figure shows the amount of eligible and included doctors throughout the study accompanied by the amount of videotaped patients per doctor in pre-and post-measurements.