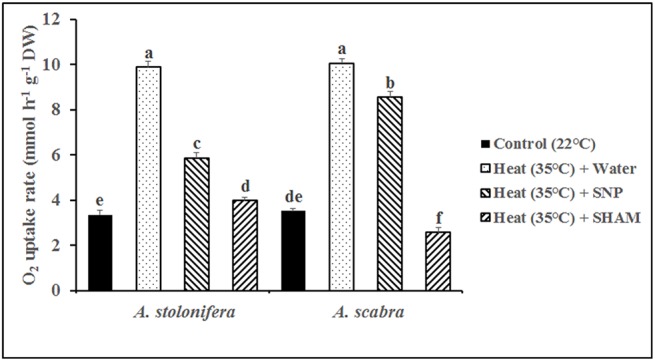
Fig 8. Root respiration rate for A. stolonifera and A. scabra under heat stress condition as affected by SNP or SHAM.

Data shown are the mean ± SE of four biological replicates. Different letters atop bars indicate significant differences exist at the P ≤ 0.05 level.
