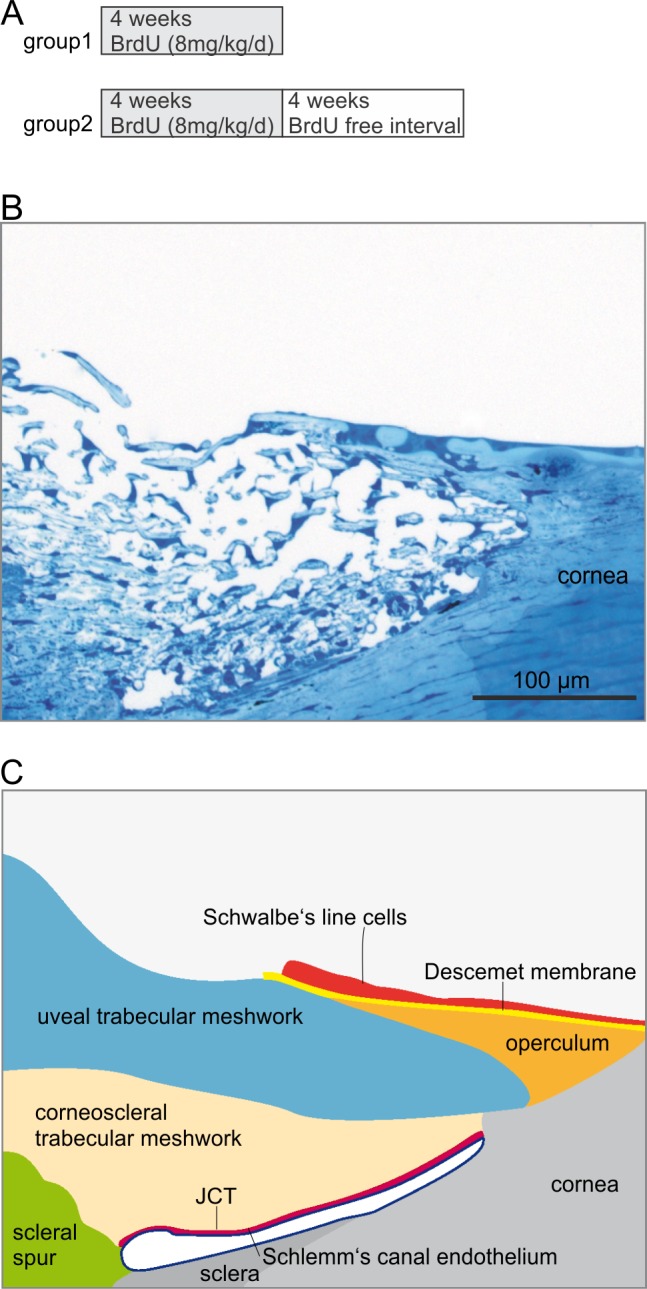
Figure 1.

Experimental setup and data analysis. (A) Schematic of the BrdU treatment protocol. (B, C) 1-μm semi-thin section through the chamber angle of a monkey eye (B) and schematic drawing (C) of the different regions that were analyzed for presence of BrdU-positive cells.
