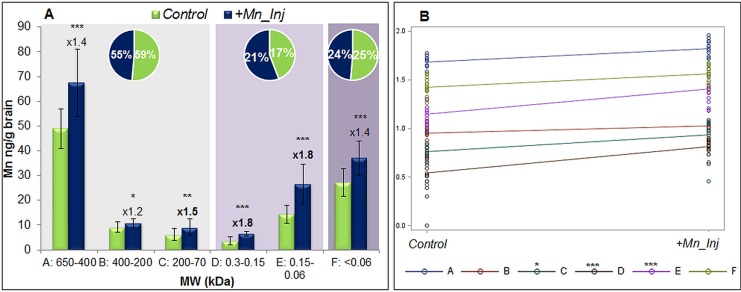
Fig 2. Concentrations of Mn from different species in brain extracts according to SEC-ICP-MS.
(A) The figure shows by columns the respective Mn concentrations of SEC fractions A-F (MW in kDa) for control and +Mn samples as well at the fold-change in increase (n = 15 per group). The pie charts show the percentage of Mn in each group (HMM, LMM or inorganic Mn) compared to total Mn in the aqueous brain extracts. A slight decrease in brain HMM was accompanied by an increase of Mn at LMM carriers in Mn-exposed animals. (B) Interaction plot from two-way ANOVA of results from Mn-speciation. Fractions C, D, and E were shown to have significant effects compared to the control group, which is in line with the findings in the fold-changes from t-test. *p<0.05, **p<0.01, ***p<0.001.

