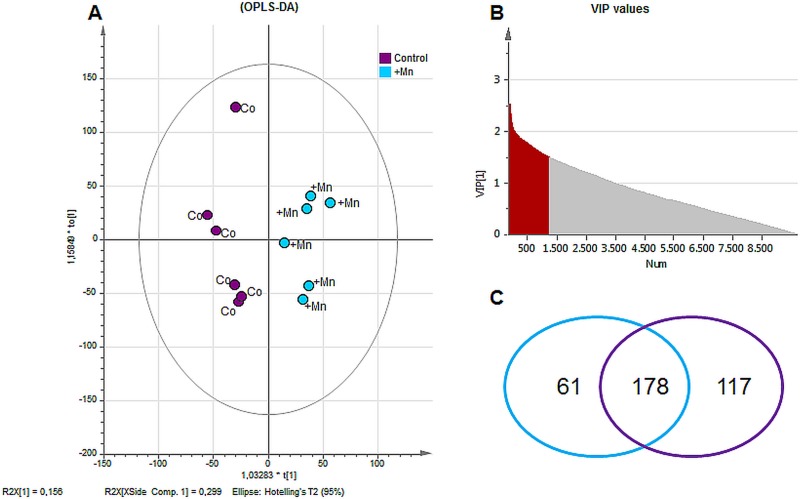
Fig 3. Data elaboration from ESI-FT-ICR-MS measurement.
(A) Score Scatter Plot of OPLS-DA of detected metabolites by ESI-ICR/FT-MS revealed a good separation between control (Co) and Mn exposed group (+Mn). (B) Distribution of VIP values (variables important in projection) of metabolites from OPLS-DA: metabolites with values ≥1.50 were chosen to be important for group separation (important metabolites, in grey). (C) Annotation of detected masses by MassTRIX webserver revealed in total 1332 known masses. According to multivariate analysis, 178 of the annotated/known metabolites were determined as important metabolites with 117 metabolites being characteristic for the control group and 61 metabolites being characteristic for +Mn group.

