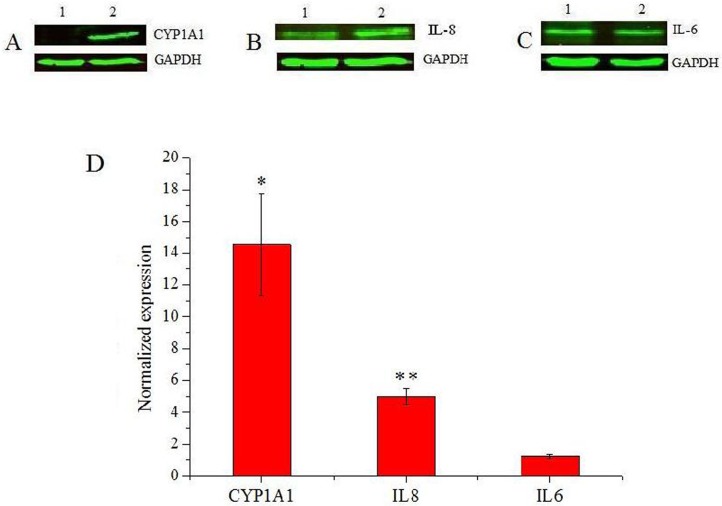
Fig 7. The fold changes in CYP1A1, IL-8 and IL-6 expression between control and PM2.5 treated 16HBE cells confirmed by western blot analysis.
A-C. The expression of CYP1A1, IL-8 and IL-6, respectively, detected by western blot analysis of cell lysates. In each gel image the left lane (1) contained untreated control cells and the right lane (2) contained cells treated with 25 μg/cm2 PM2.5. GAPDH was used as a loading control. D. Quantitation of western blot band intensity (n = 3). Data is expressed as mean ± SD. (*) indicates significant difference (p < 0.05) when compared to control, (**) represents significant difference (p < 0.01) compared to control.

