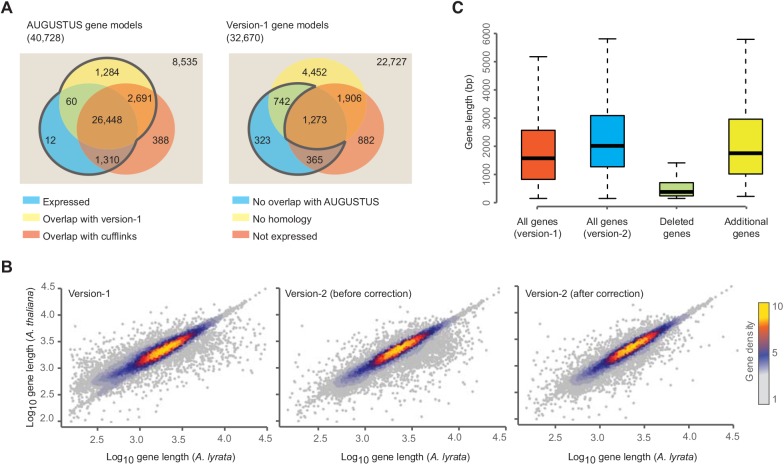
Fig 1. Updating the gene model annotation of A. lyrata.
(A) Left, version-2 gene models predicted by Augustus [28]. Number of gene models overlapping with version-1 (yellow), genes predicted with Cufflinks (red), and genes with expression evidence (blue). Right, gene models of the version-1 annotation. Number of models without overlap to version-2 models (yellow), without orthologs in five other Brassicaceae (red), and without significant expression evidence (blue). (B) Correlation of the lengths of A. lyrata gene models with the length of their orthologous gene models in A. thaliana. Left, A. lyrata version-1 gene models. Correlations using version-1 gene models (left), version-2 gene models before (middle) and after (right) the homology-based correction of gene models. (C) Length distribution of gene models including genes that were removed or newly added in the version-2.

