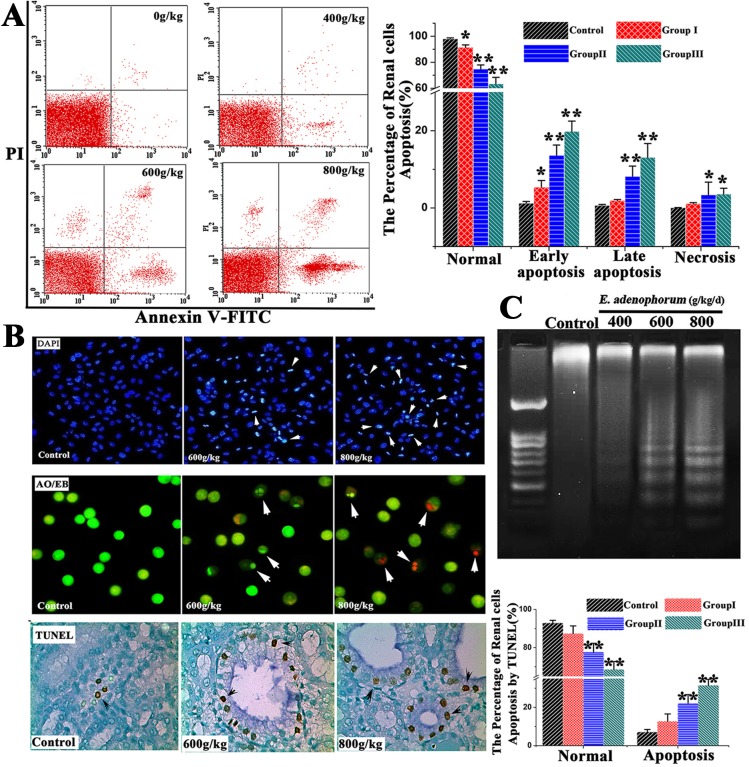
Fig 2. E. adenophorum administration induces apoptosis in renal cells.
(A) The scattergram of apoptotic renal cells. The renal cells were analyzed for apoptosis by flow cytometry for Annexin V and PI staining. The percentage number of renal cells apoptosis(%) were shown. E. adenophorum significantly induced apoptosis in renal cells.(B) The Detection of apoptotic renal cells by DAPI, AO/EB staining and TUNEL assay. Representative kidney sections from saanen goats were analyzed using TUNEL assay for apoptotic cell death. The number of TUNEL positive cells (indicated arrows) in kidney was counted from five random microscopic fields. Magnification, x400. Nuclear morphological changes in renal cells were observed under fluorescent microscope after DAPI staining (indicated arrows, 200×) and DAPI or AO/EB staining (400×). (C) Induction of DNA fragmentation. DNA isolated from E. adenophorum-administration renal cells was subjected to 2% agarose gel electrophoresis, followed by visualization of bands and photography. Data are presented with the means±SD and mean values of three independent experiments. *p<0.05 and **p<0.01, compared with the control group.

