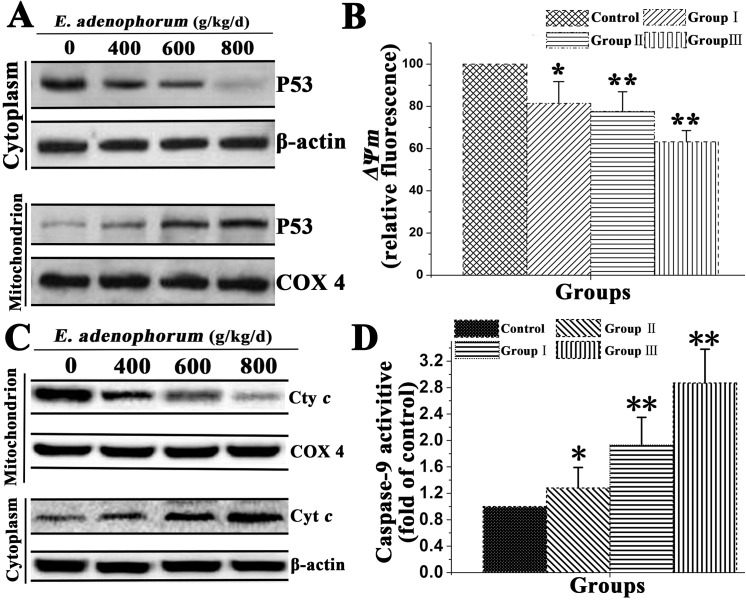
Fig 5. Mitochondrial p53 activates mitochondrial pathway in renal cells.
To determine localization of p53, renal cells were incubated as indicated (A) Western blot analyzed the effect of E. adenophorum on p53 mitochondrial translocation. COX 4, mitochondrial loading control. (B) Flow cytometry and JC-1 measure the effet of E. adenophorum on ΔΨm. (C) Western blot was conducted to analyze the release of Cyt c in renal cells. (D) The effect of E. adenophorum on enzymatic activity of caspase-9 was measured and was expressed relative to the control. Date are presented with the means±SD and mean values of three independent experiments. *p<0.05 and **p<0.01 compared with the control group.

