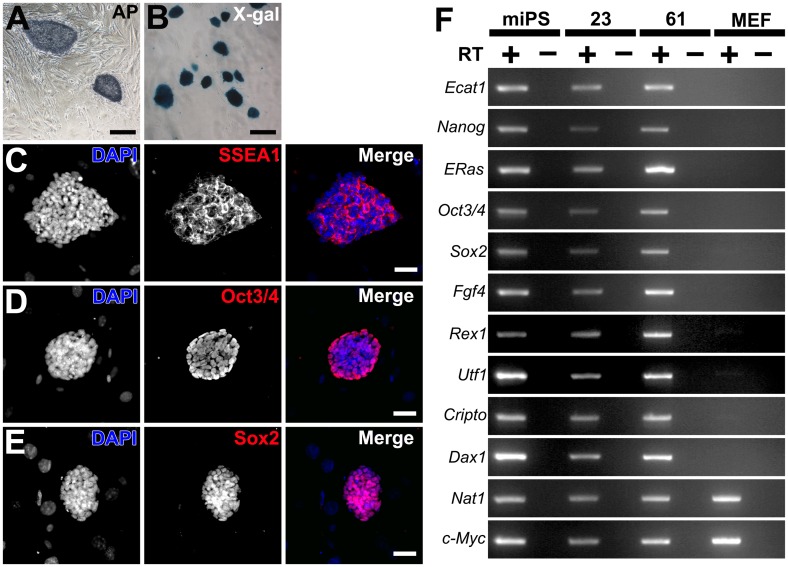
Fig 2. Characterization of iPSCs derived from NSCs of P0-Cre;Z/EG mice (P/G-iPSCs).
AP staining (A), X-gal staining (B), and immunostaining (C; SSEA-1, D; Oct3/4, and E; Sox2) of P/G-iPSCs (clone 61) grown on MEF feeder cells. Scale bars indicate 200 μm (A, B) and 100 μm (C–E). F, RT-PCR analysis of ESC marker gene expression in WT-iPSCs, P/G-iPSCs (clones 23 and 61), and MEFs. Nat1 was used as an internal control. PCR products were amplified from cDNA samples with (+) or without (−) reverse transcriptase.

