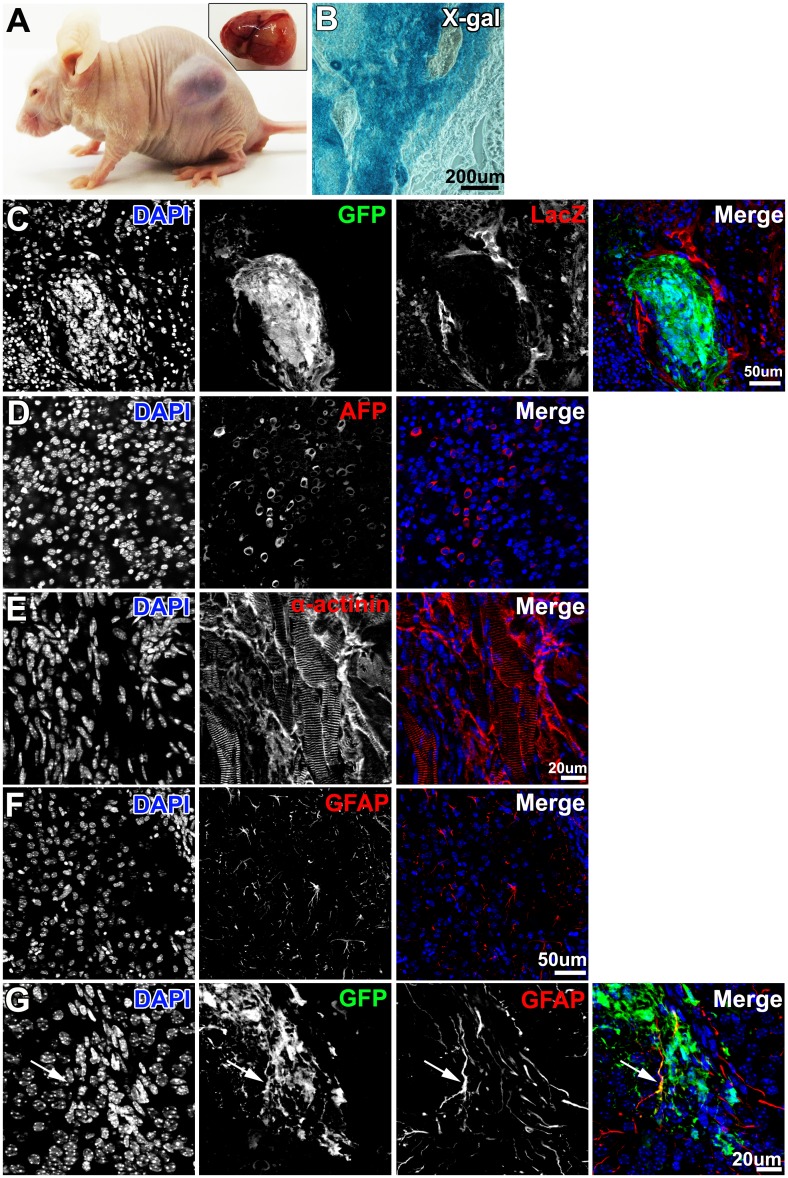
Fig 4. Teratoma formation of P/G-iPSCs.
A, Teratoma formation of P/G-iPSCs (clone 61) after transplantation into a nude mouse. The inset shows a removed tumor. B, X-gal staining of tumors. C, Immunostaining of tumors for GFP (green) and LacZ (red). D–F, Immunostaining of tumors for α-fetoprotein (D, red), α-actinin (E, red), and GFAP (F, red). G, Immunostaining of tumors for GFP (green) and GFAP (red). Arrows indicate GFP and GFAP double-positive cells. Blue represents DAPI staining. Scale bars indicate 200 μm (B), 50 μm (C, D, F), and 20 μm (E, G).

