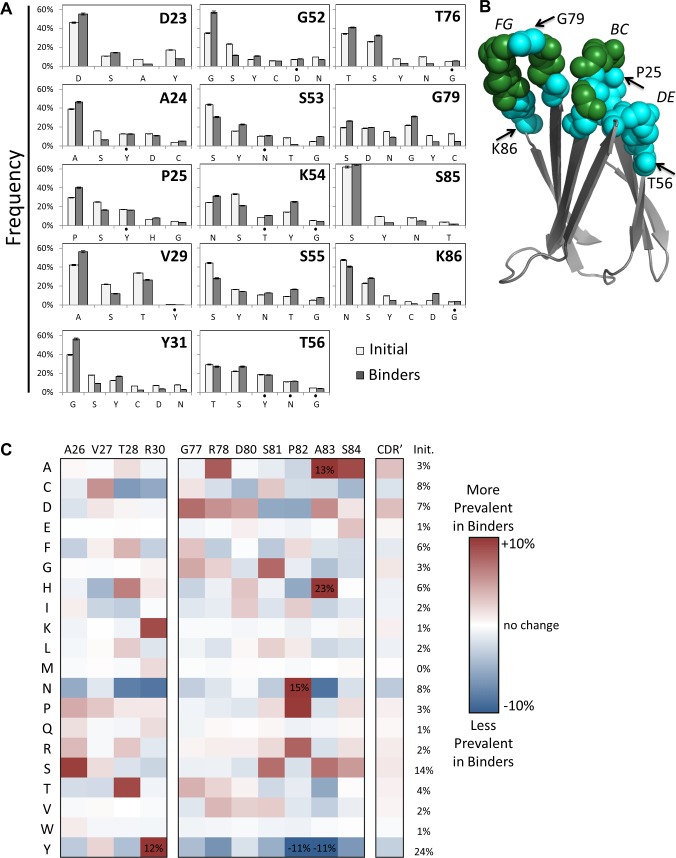
Fig 2. First generation sitewise amino acid distribution.
(A) The amino acid frequencies at the indicated sites for the first generation library (white) and the binding populations (gray). Bars and error bars are mean ± standard deviation. Statistical significance, while adjusting for family wise error rate using Bonferroni method, was achieved at level α = 0.005 for all data with the exception of those denoted (•). (B) Solution structure (PDB: 1TTG) of wild-type fibronectin domain with backbone residues of diversified loop sites denoted by spheres. BC, DE, and FG loops are labeled as are several sites for reference. (C) The difference between the amino acid frequencies in the binding populations and the first generation library are shown for each amino acid at each site. The average across all fully diversified sites is also presented. Init. indicates the average amino acid frequency in the initial library across all CDR’ sites.

