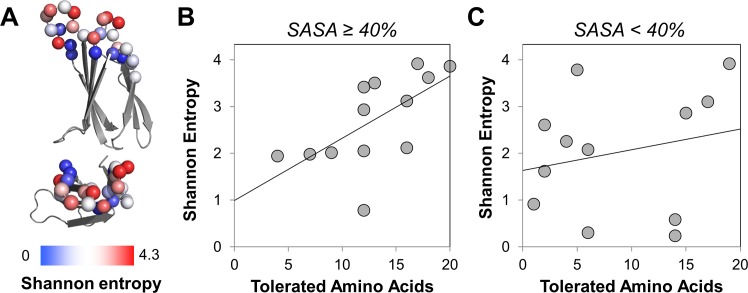
Fig 7. Shannon entropy landscape among binding population.
(A) The α carbons of evaluated sites are shown in spheres colored based on Shannon entropy of binding sequences from the second generation campaigns. (B, C) The Shannon entropies at each site of second generation binders are plotted versus the number of amino acids that are tolerated at that site based on computational stability predictions. (B) Sites with solvent accessible surface area (in other fibronectin domain mutants) ≥40%. Pearson coefficient = 0.63. Slope = 0.13. (C) Sites with solvent accessible surface area <40%. Pearson coefficient = 0.22. Slope = 0.04.

