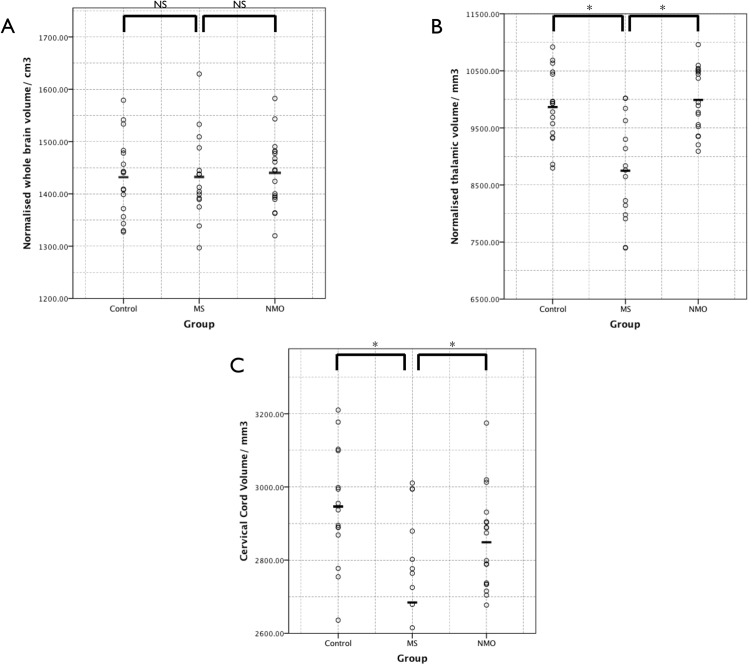
Fig 1. Results of the cross-sectional volumetric analyses.
The dots show individual patient results and the bars the group mean. Individual and mean results have not been normalised for age. (A) Whole brain volume normalised for intracranial volume. (B) Thalamic volume normalised for intracranial volume. (C) Cervical spinal cord volume. NS = not significant, * = significant difference (corrected p< 0.05).

